
CityParks
A continuous learning AI model for visitation and movement data intelligence that provides footfall counts, visitor origins, demographics, spending patterns, and weather correlations for your parks, trails, open spaces, facilities, events, beaches, water bodies, and natural resources.
- From $199/month
- Unlimited users
- Available through NASPO







How agencies put CityParks to work
From capital planning to community engagement, parks and recreation agencies turn visitation intelligence into data-driven outcomes.
Park Planning
Prioritize capital investments with evidence — visitation, visitor origins, and service-area gaps show exactly where new parks, trails, and amenities are needed most.
Park Operations
Match staffing, maintenance, restrooms, and trash pickup to real usage patterns by day, hour, and season — not guesswork.
Grant Applications
Win state and federal funding with defensible visitation counts, equity analysis, and economic impact evidence that grant reviewers trust.
Local Sponsorships
Show local businesses exactly how many people their sponsorship reaches — with the audience demographics that make the case for you.
Events and Festivals
Measure attendance, dwell time, and visitor spending for every concert, festival, race, and market — prove impact and plan next year with confidence.
Community Engagement
Bring data to public meetings — show residents how their parks are actually used and back every decision with numbers everyone can see.
The many ways CityParks empowers your agency
An impressive collection of features and capabilities that parks and recreation agencies and departments of natural resources use every day.
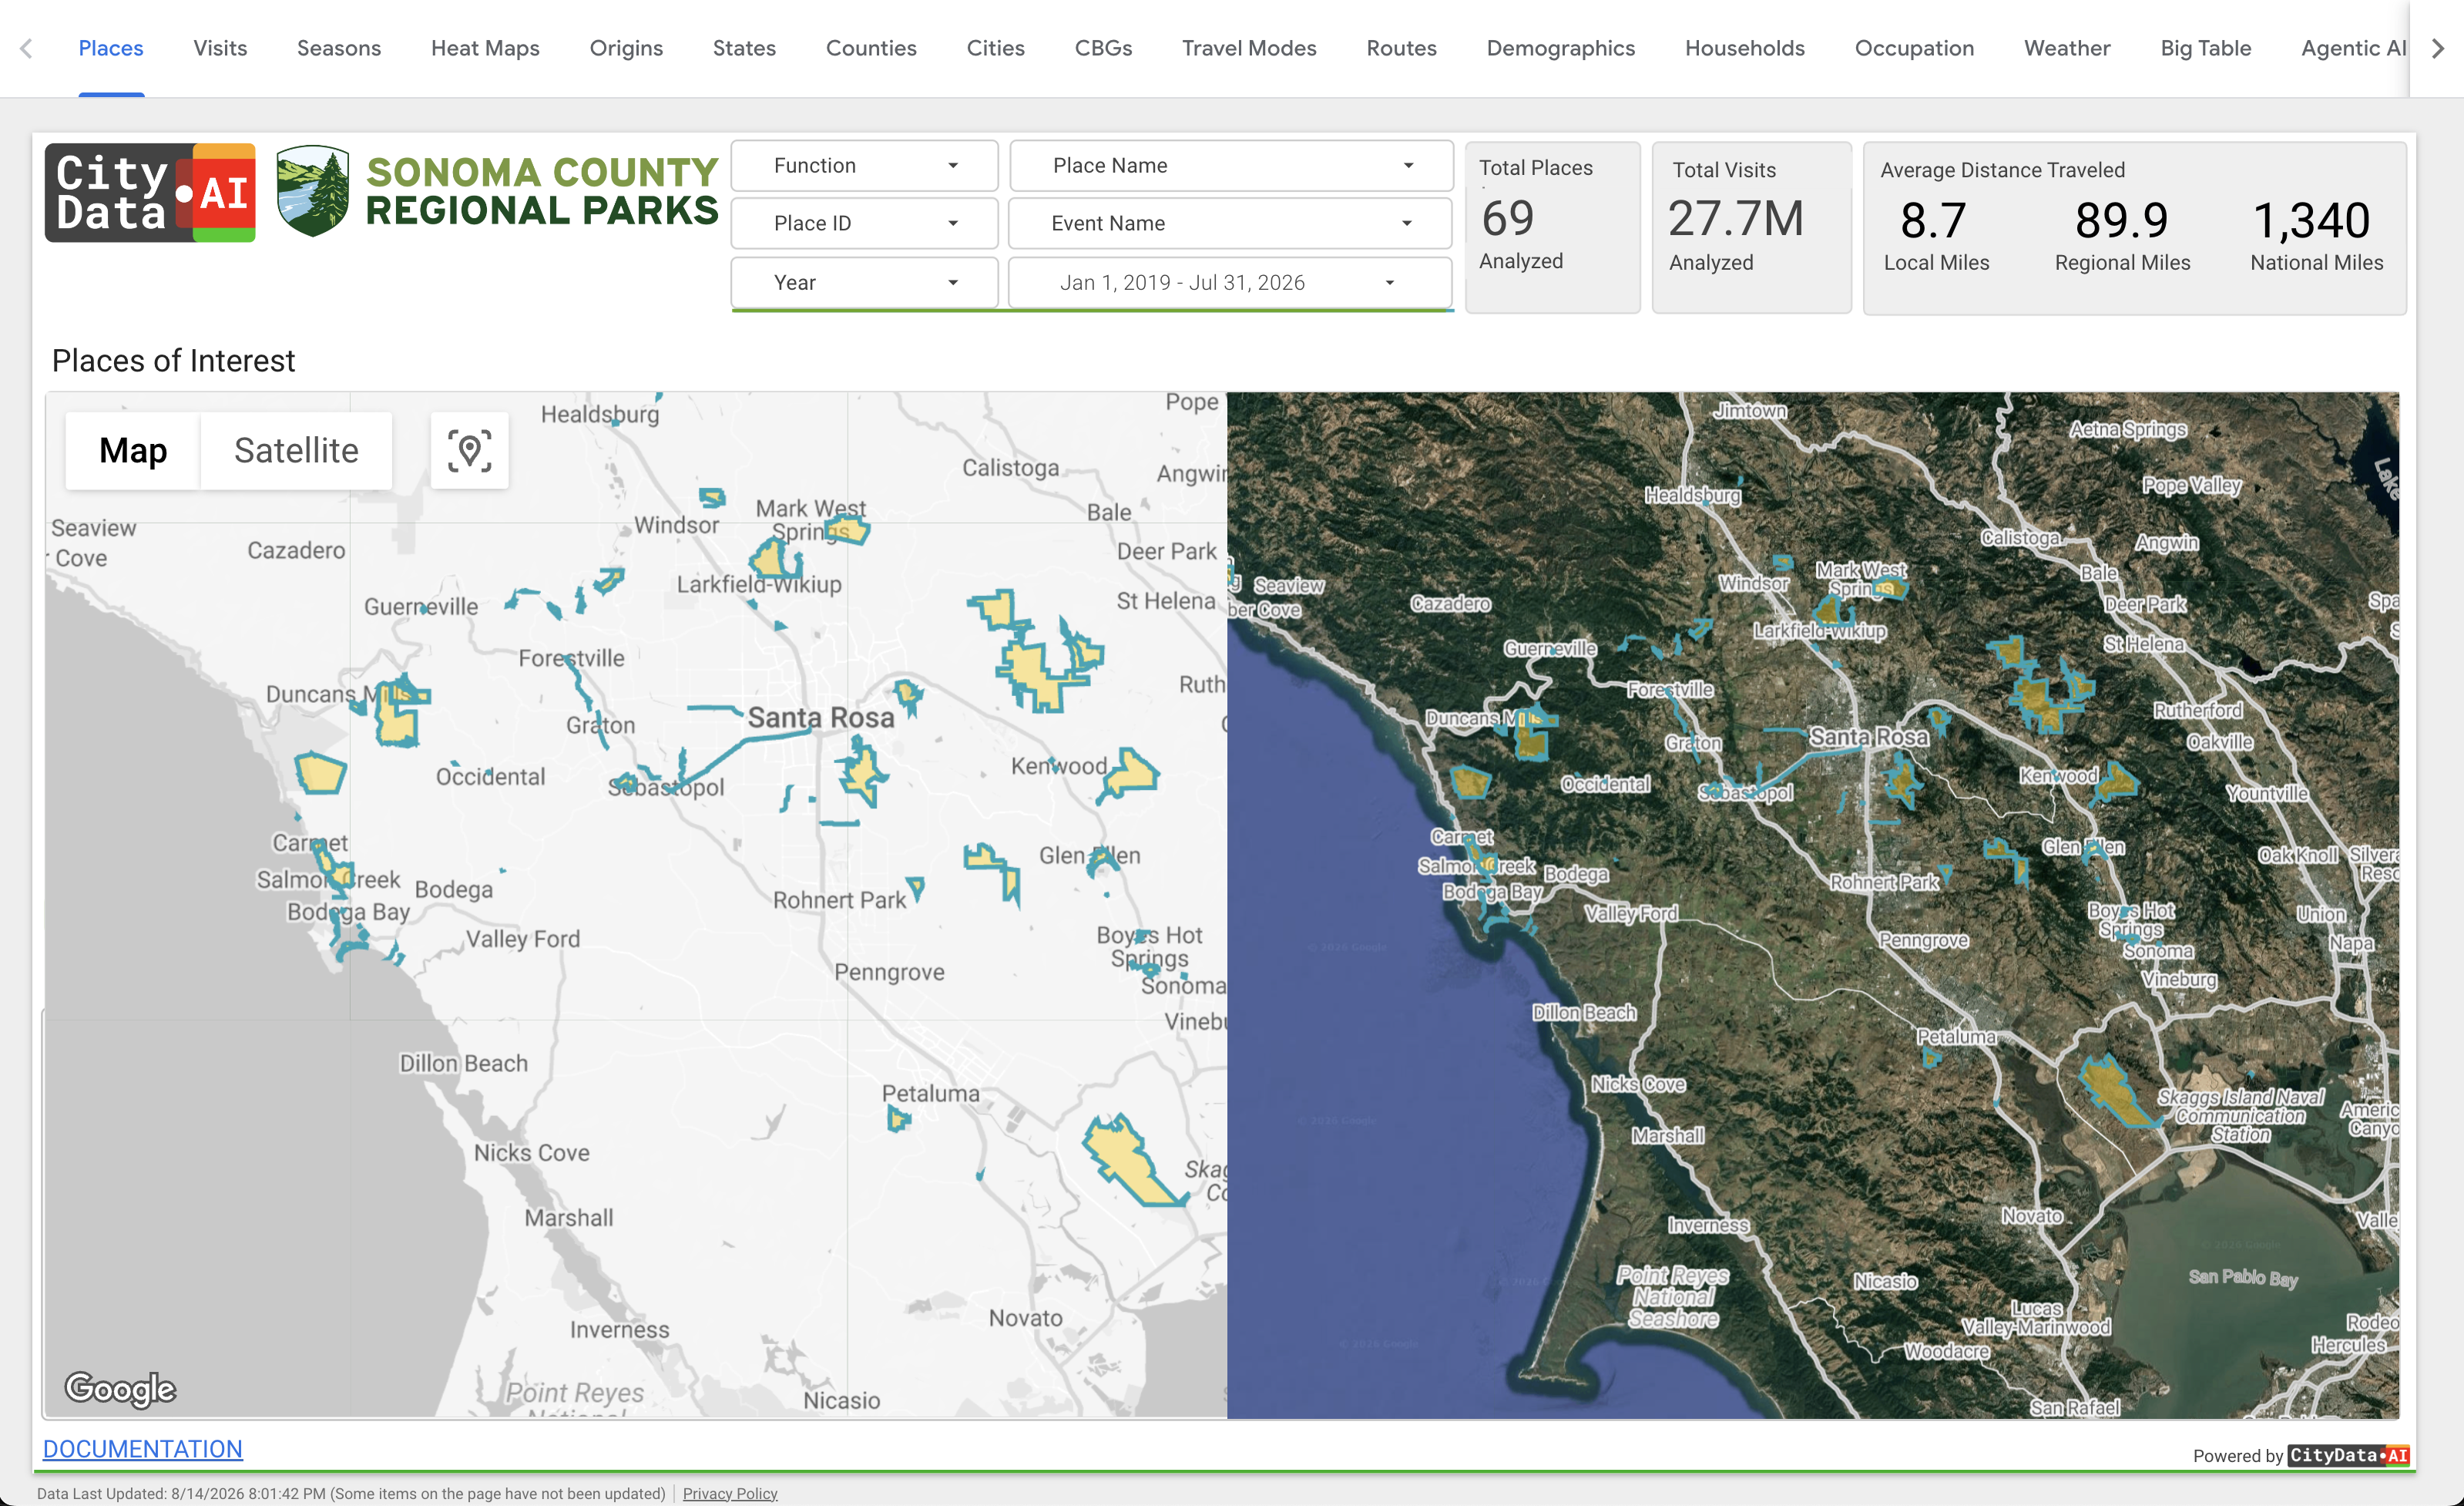
Parks, Trails and Facilities
Every park, trail, open space, and facility you manage on one geospatial map, with standard and satellite views — each dot is a place CityParks measures.
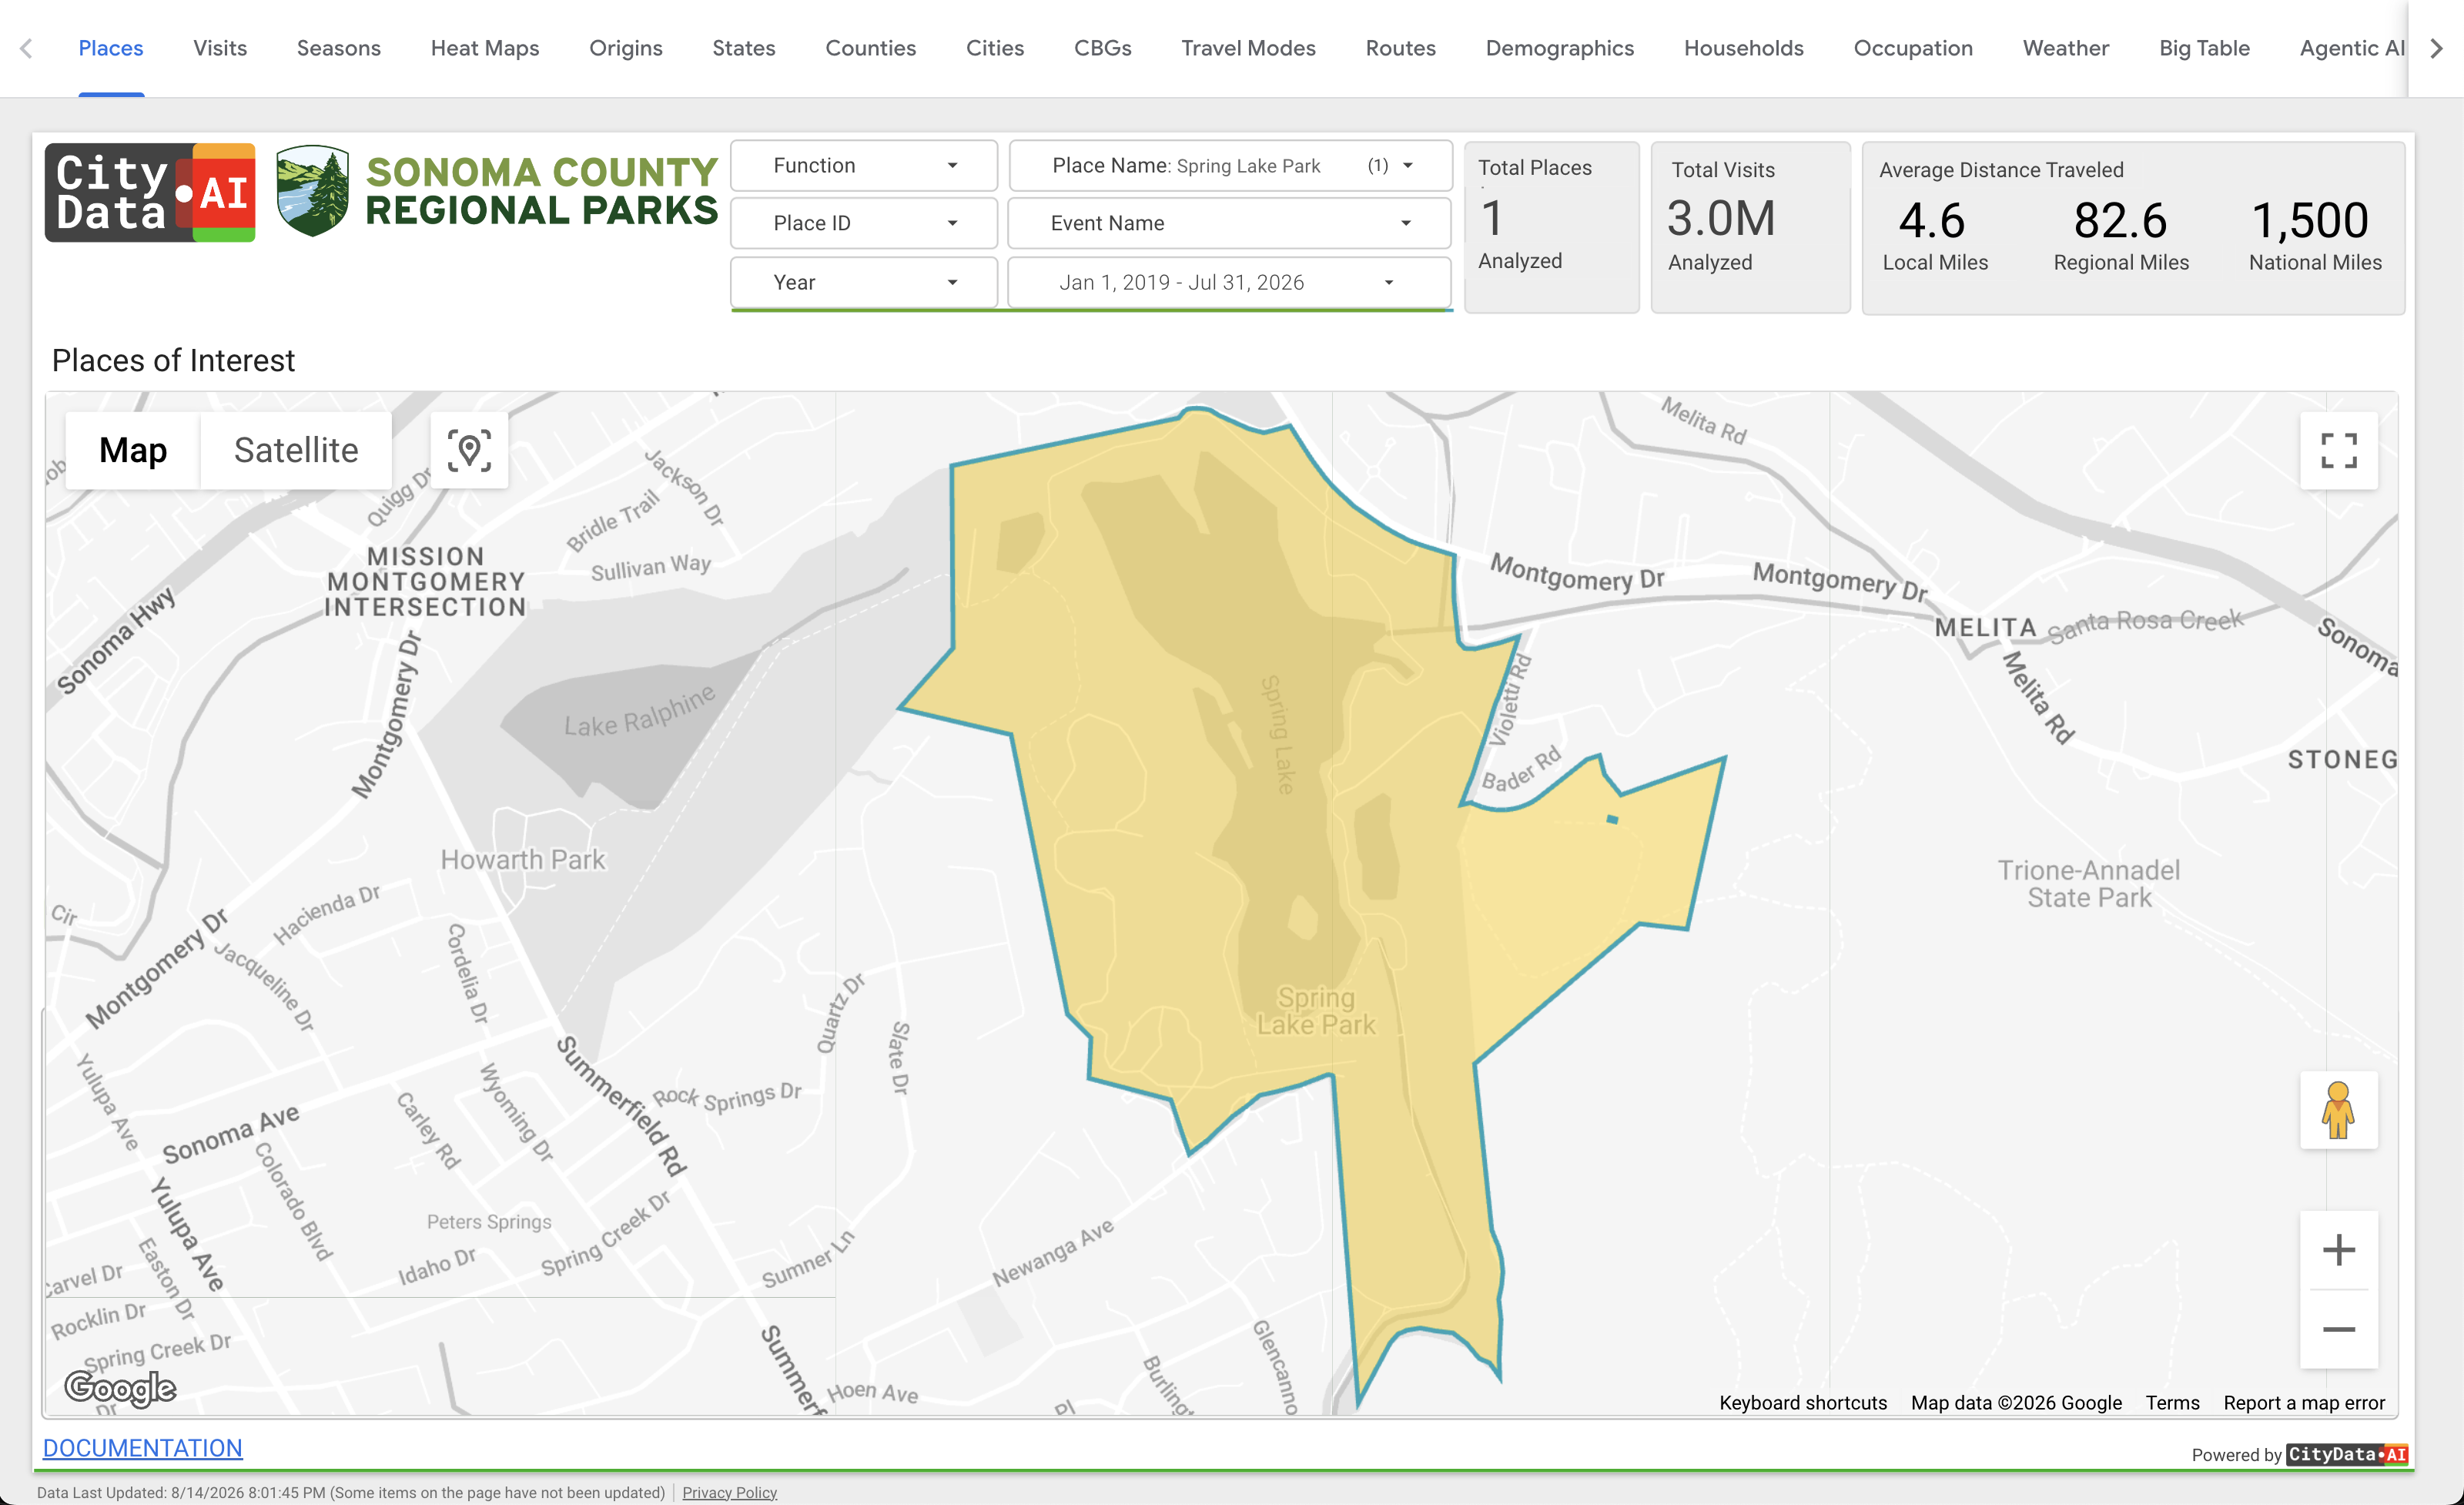
Custom-defined Geofences
Draw a custom shape around any park, trail segment, facility, or natural resource and get footfall statistics for exactly the area you define.
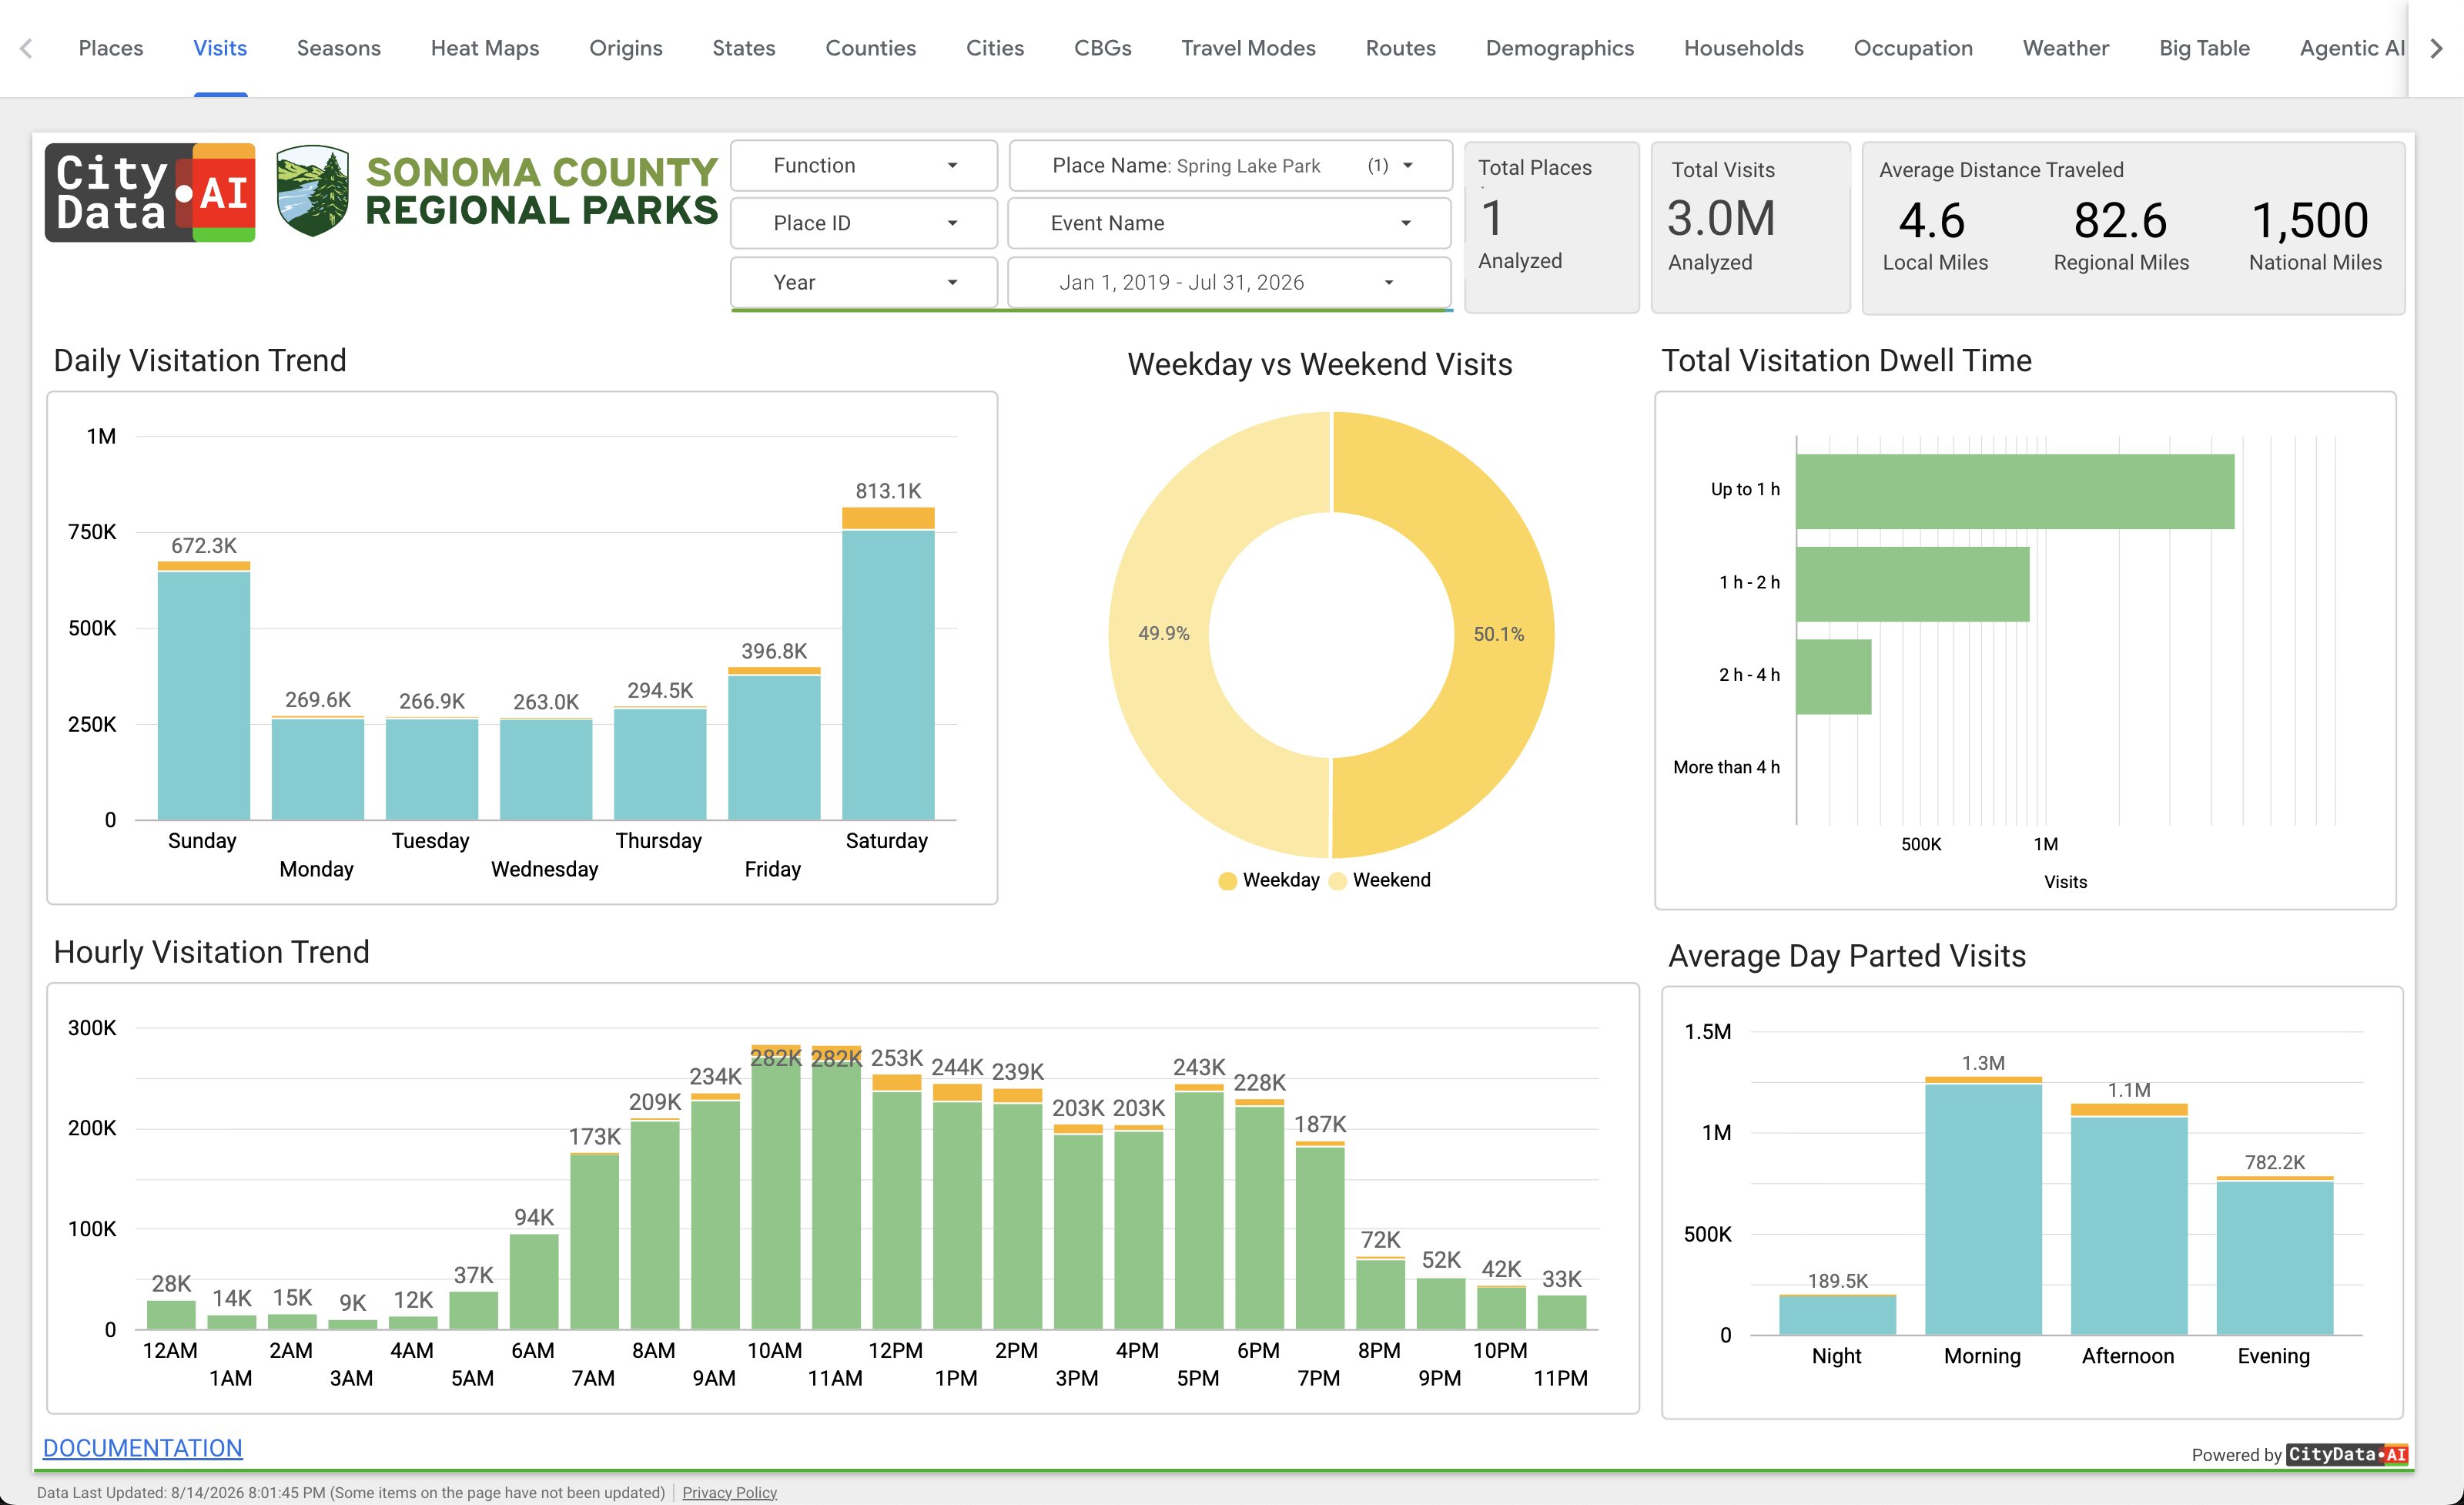
Visitation Patterns
Accurate monthly, weekly, daily, and hourly visit counts for every place in your system — inferred from mobility big data and validated against ground truth.
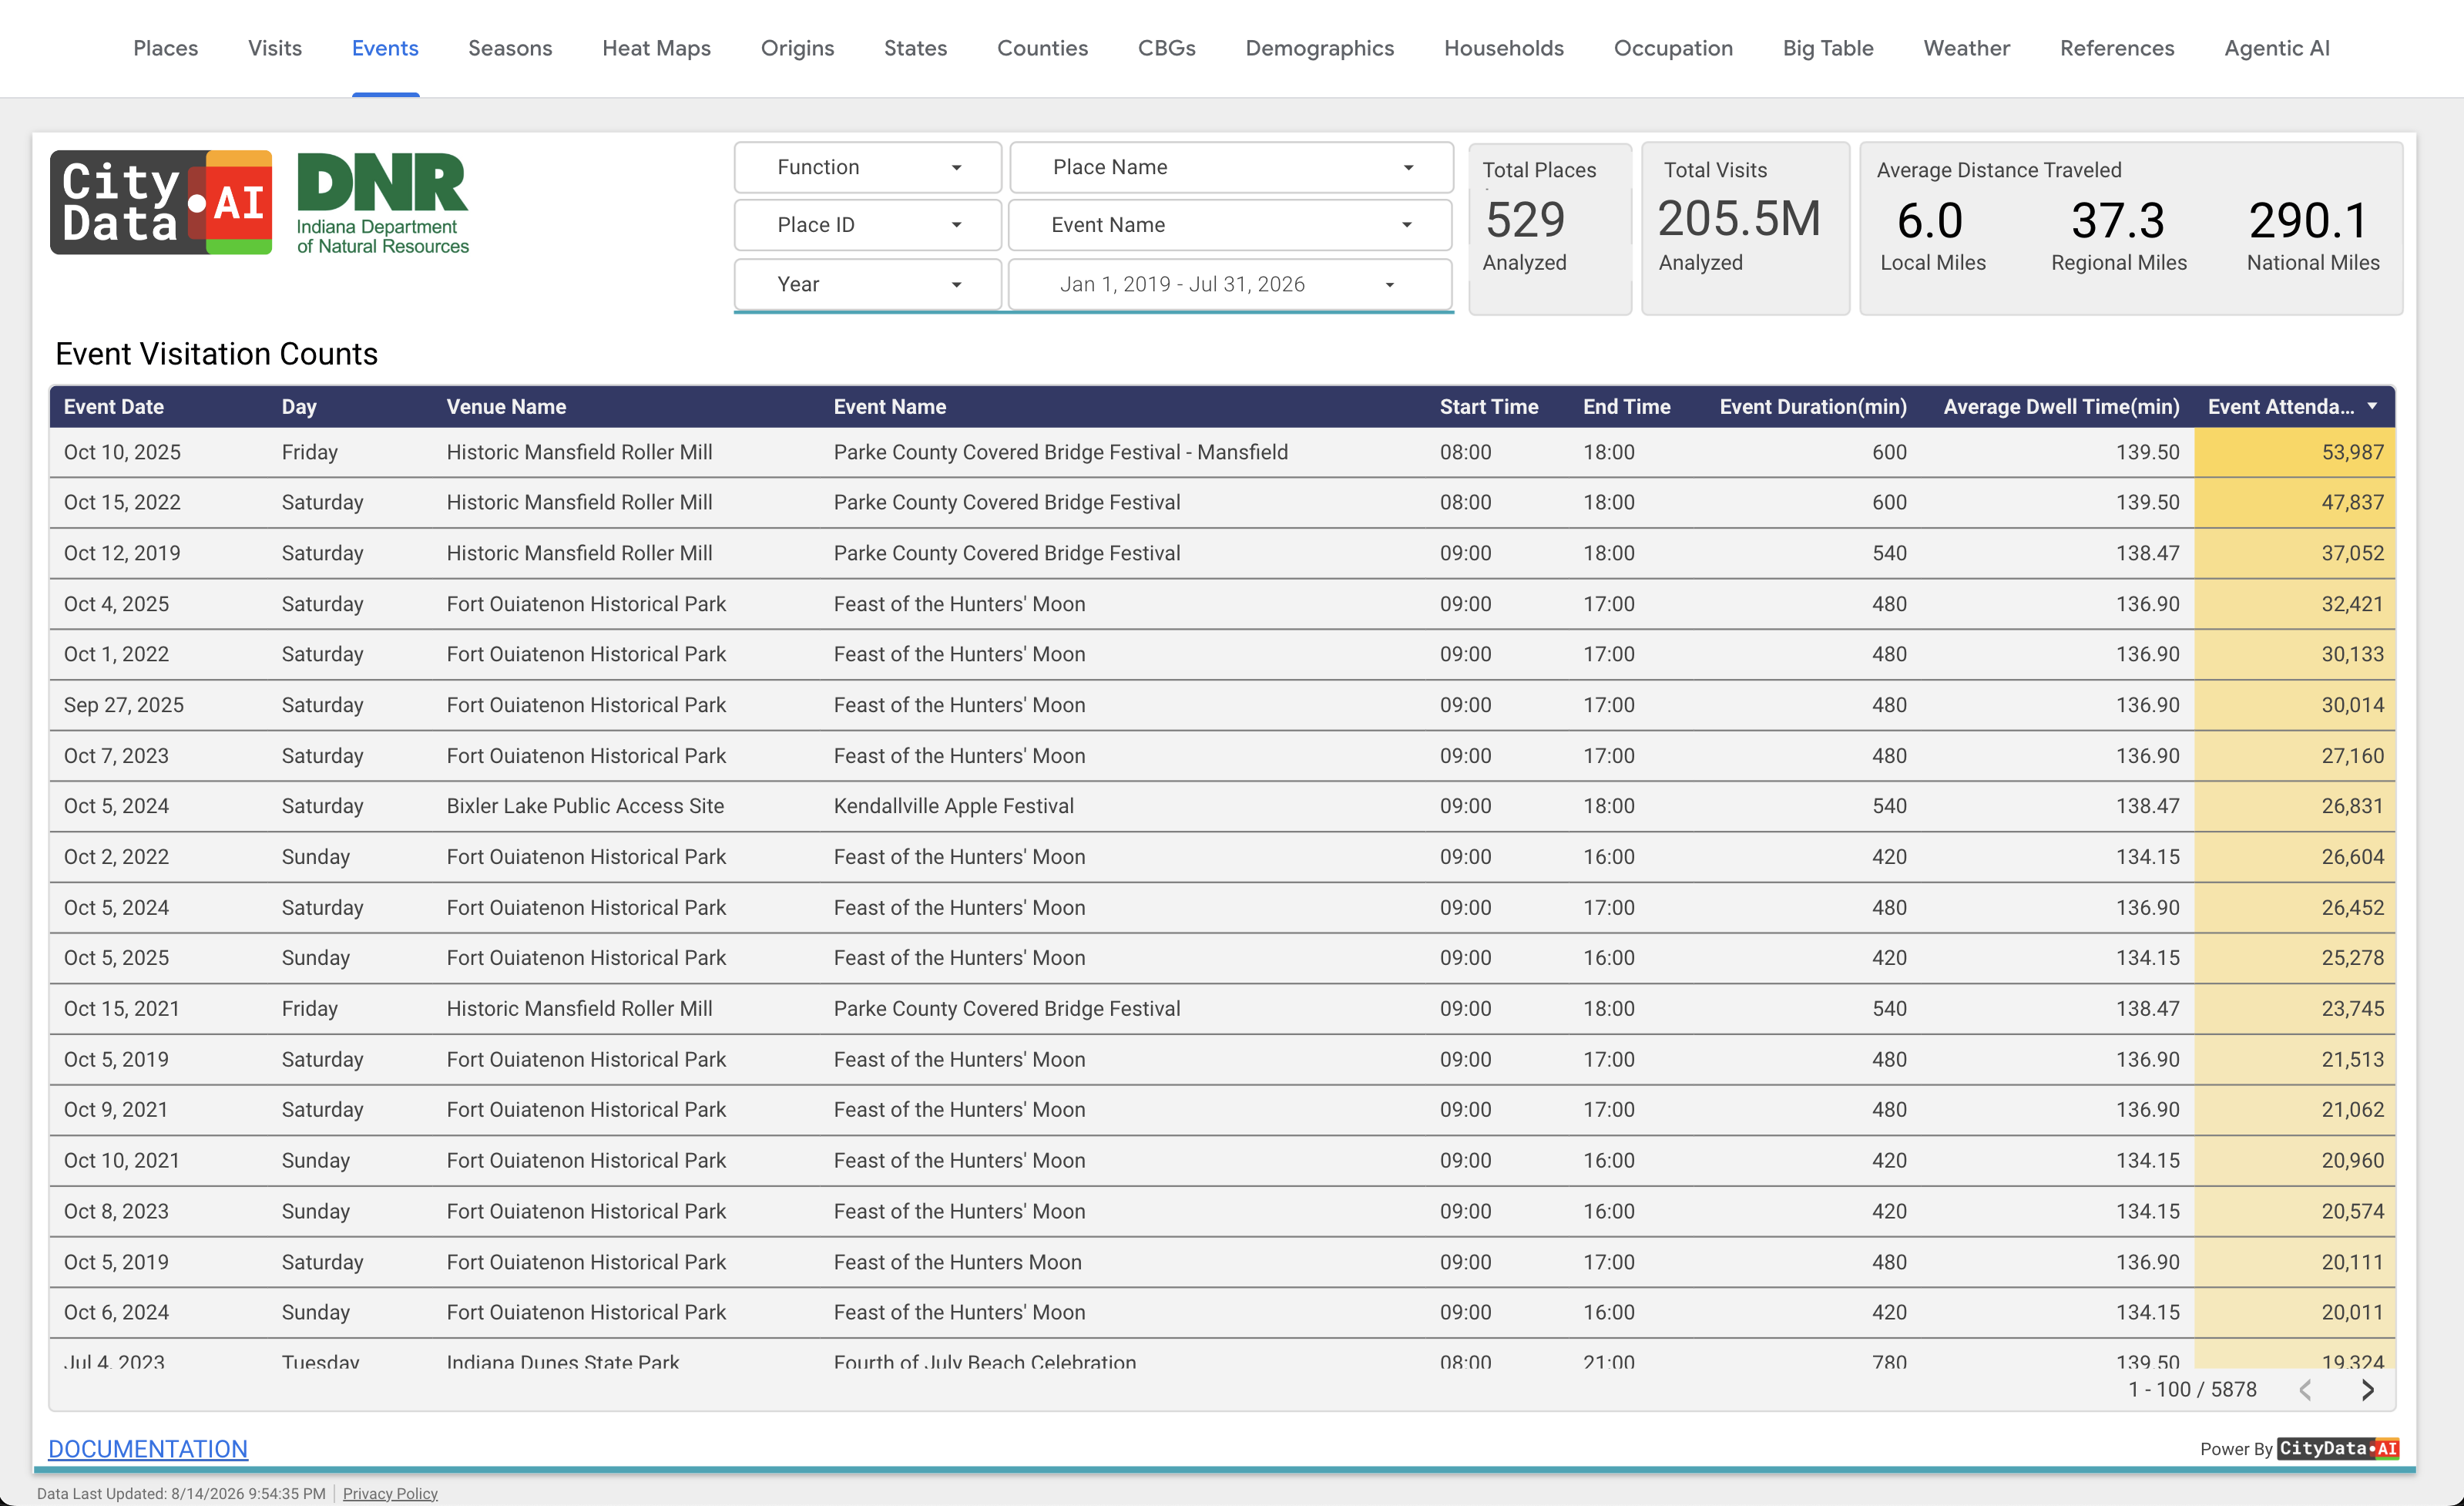
Event Attendance
Measure turnout for concerts, festivals, races, markets, and programs, and compare events year over year to prove impact to council and sponsors.
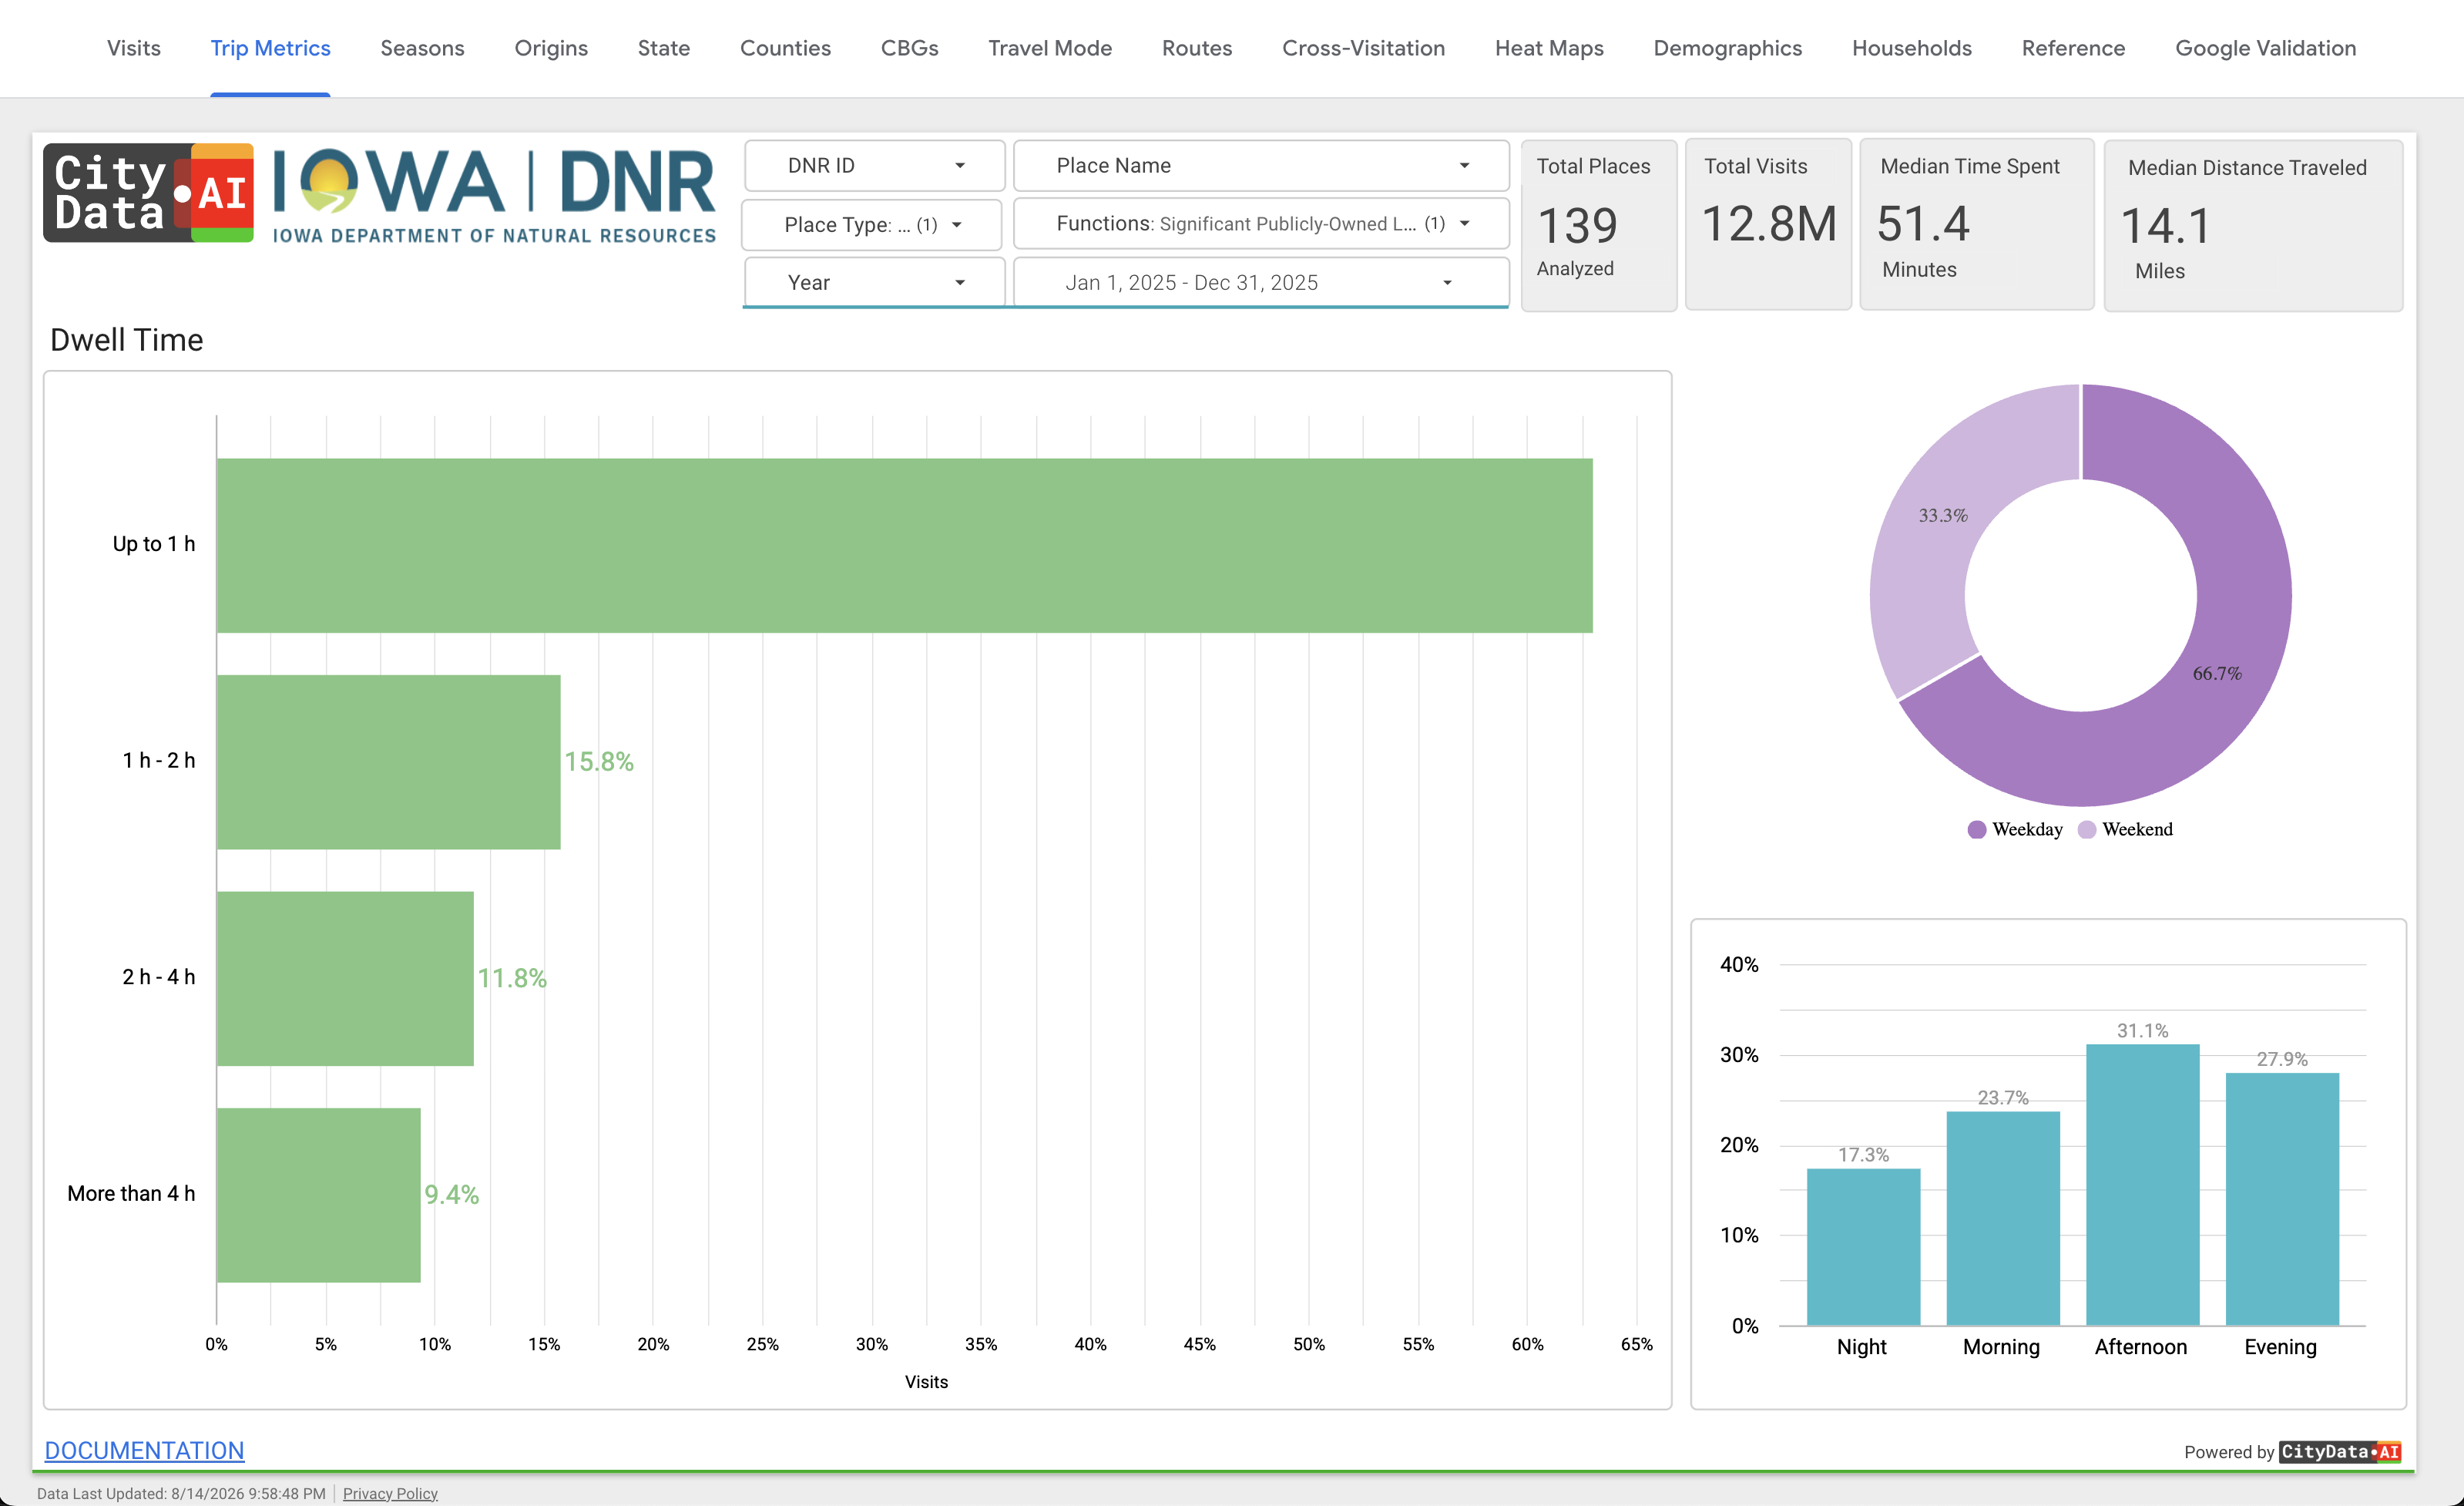
Dwell Time Analysis
Average time spent per visit, broken into dwell-time bands from under an hour to over four hours — know which parks hold visitors and which are pass-throughs.
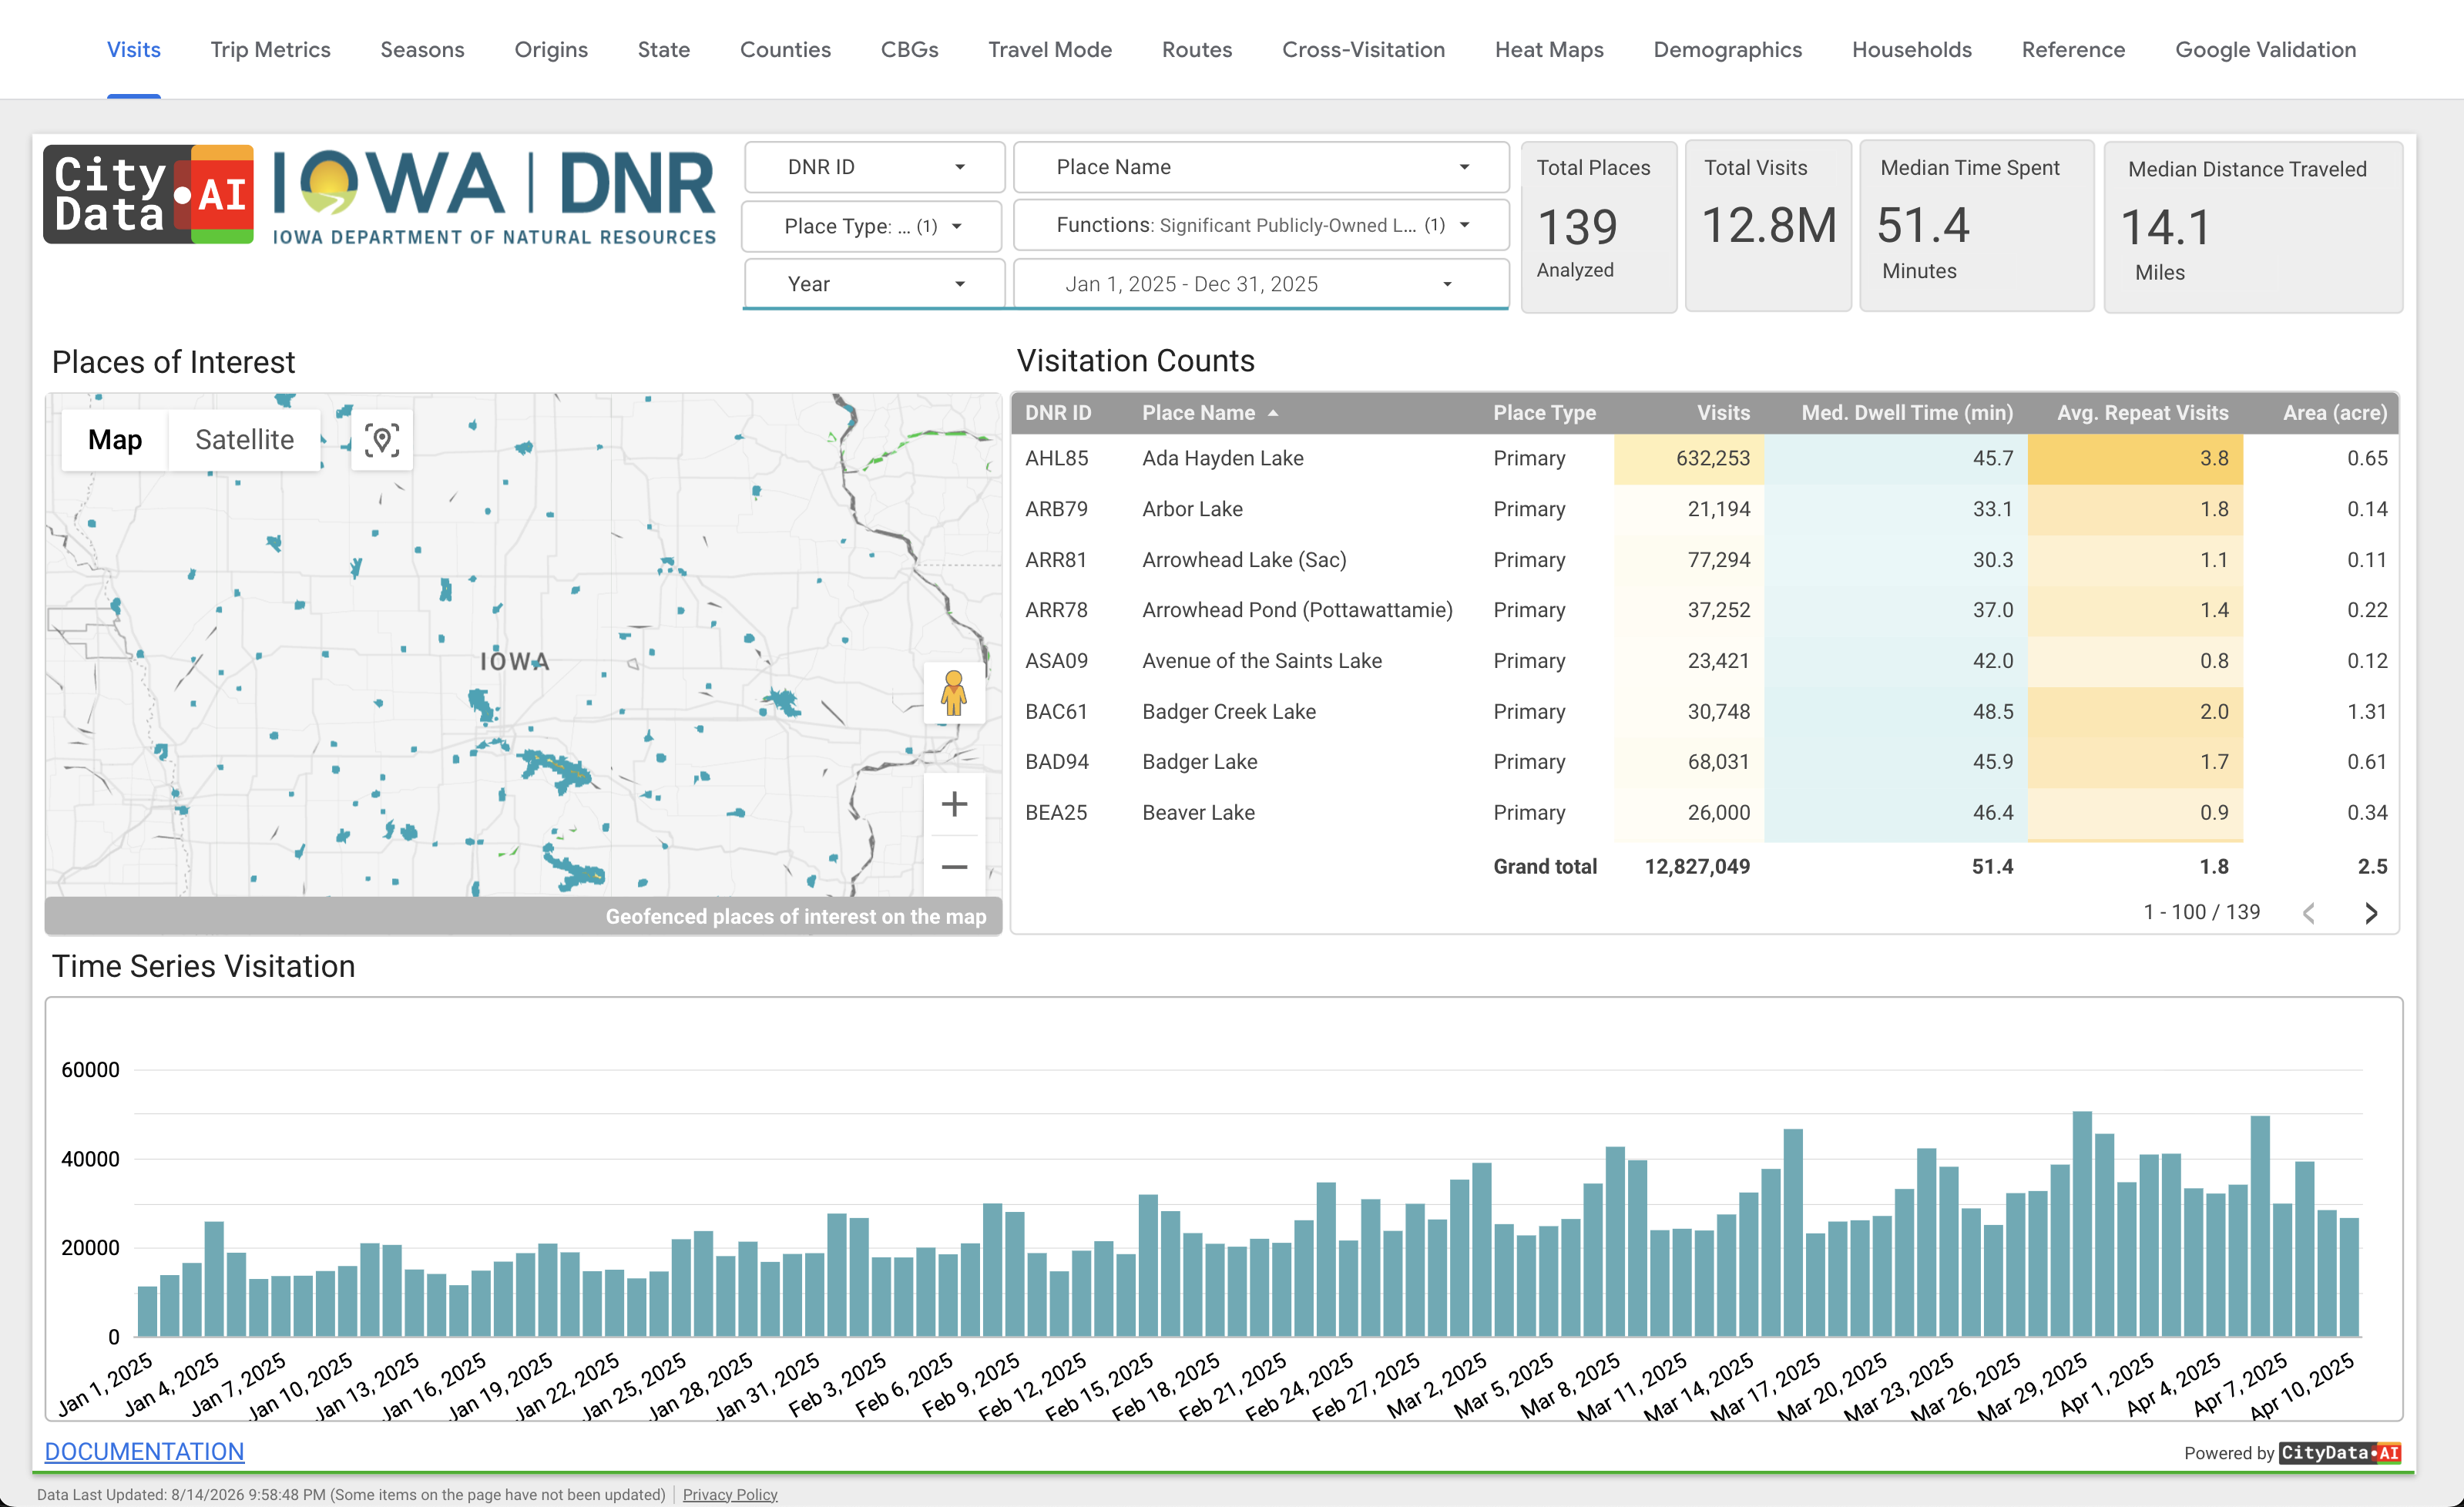
Returning Visitors
Separate first-time visitors from regulars and track how often people come back — a direct read on loyalty to every park and program.
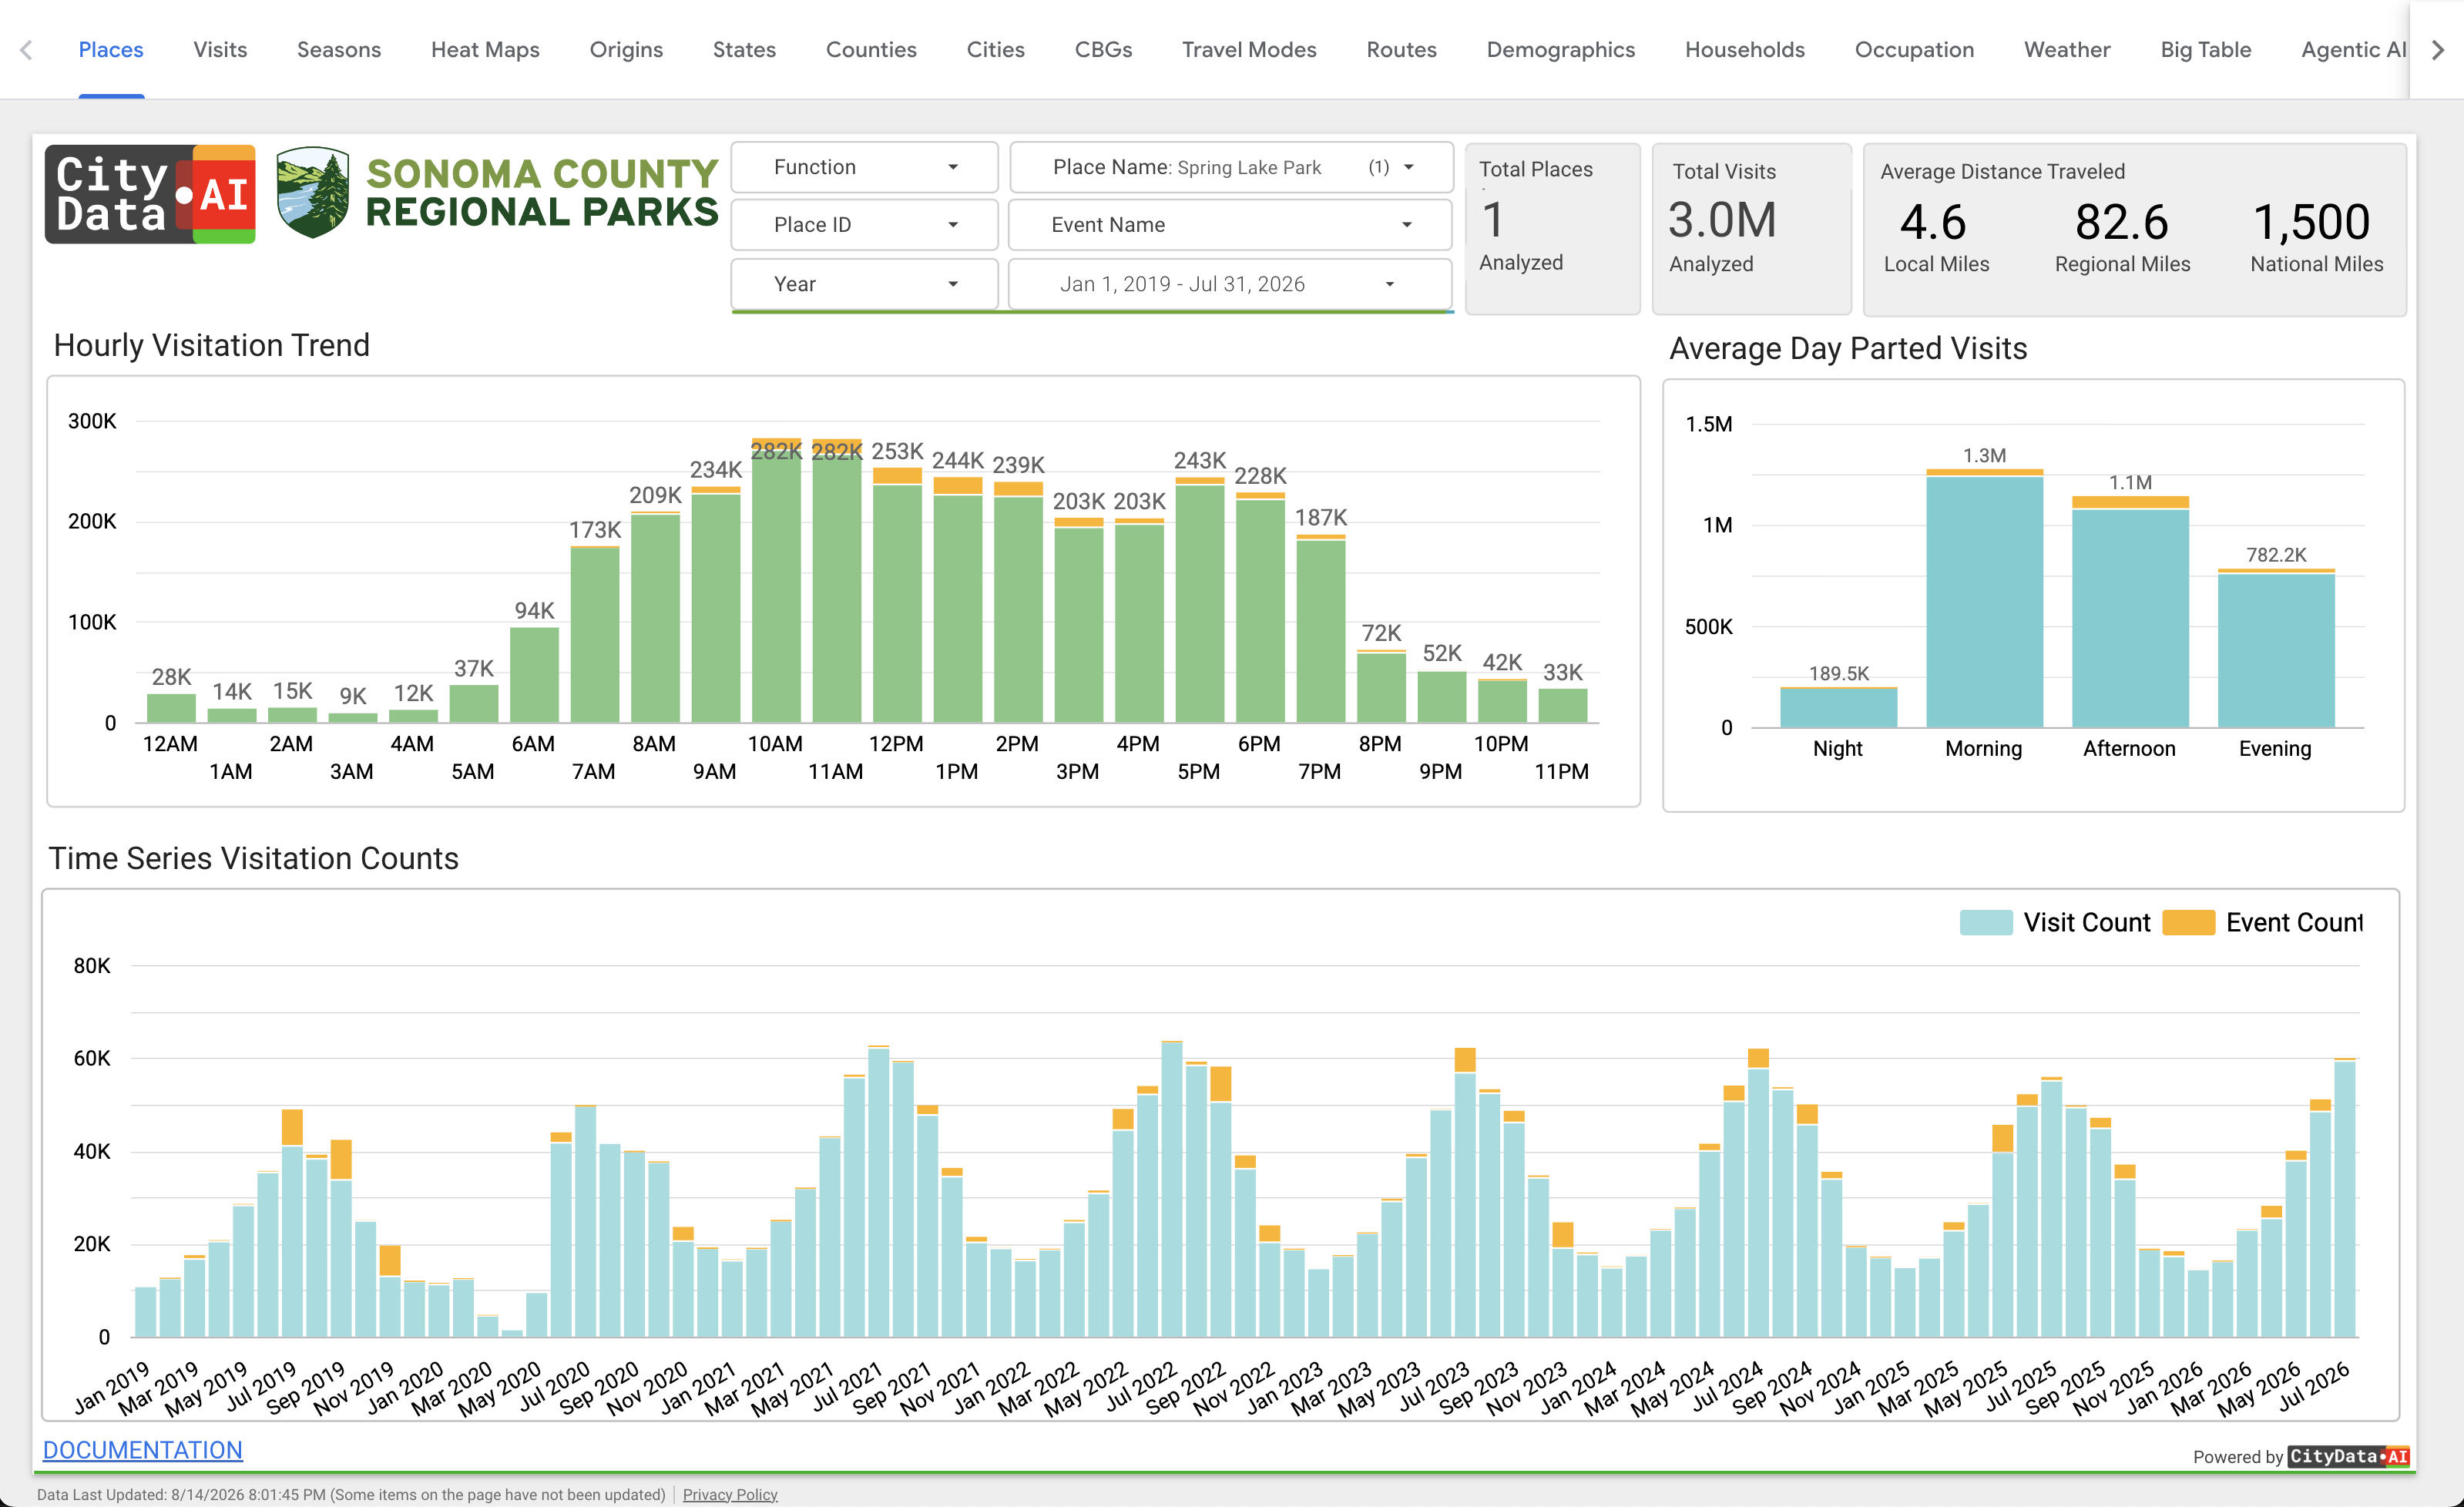
Time Series Historical Trends
Daily visitation charted across months and years to reveal growth, decline, and the impact of improvements, closures, and events.
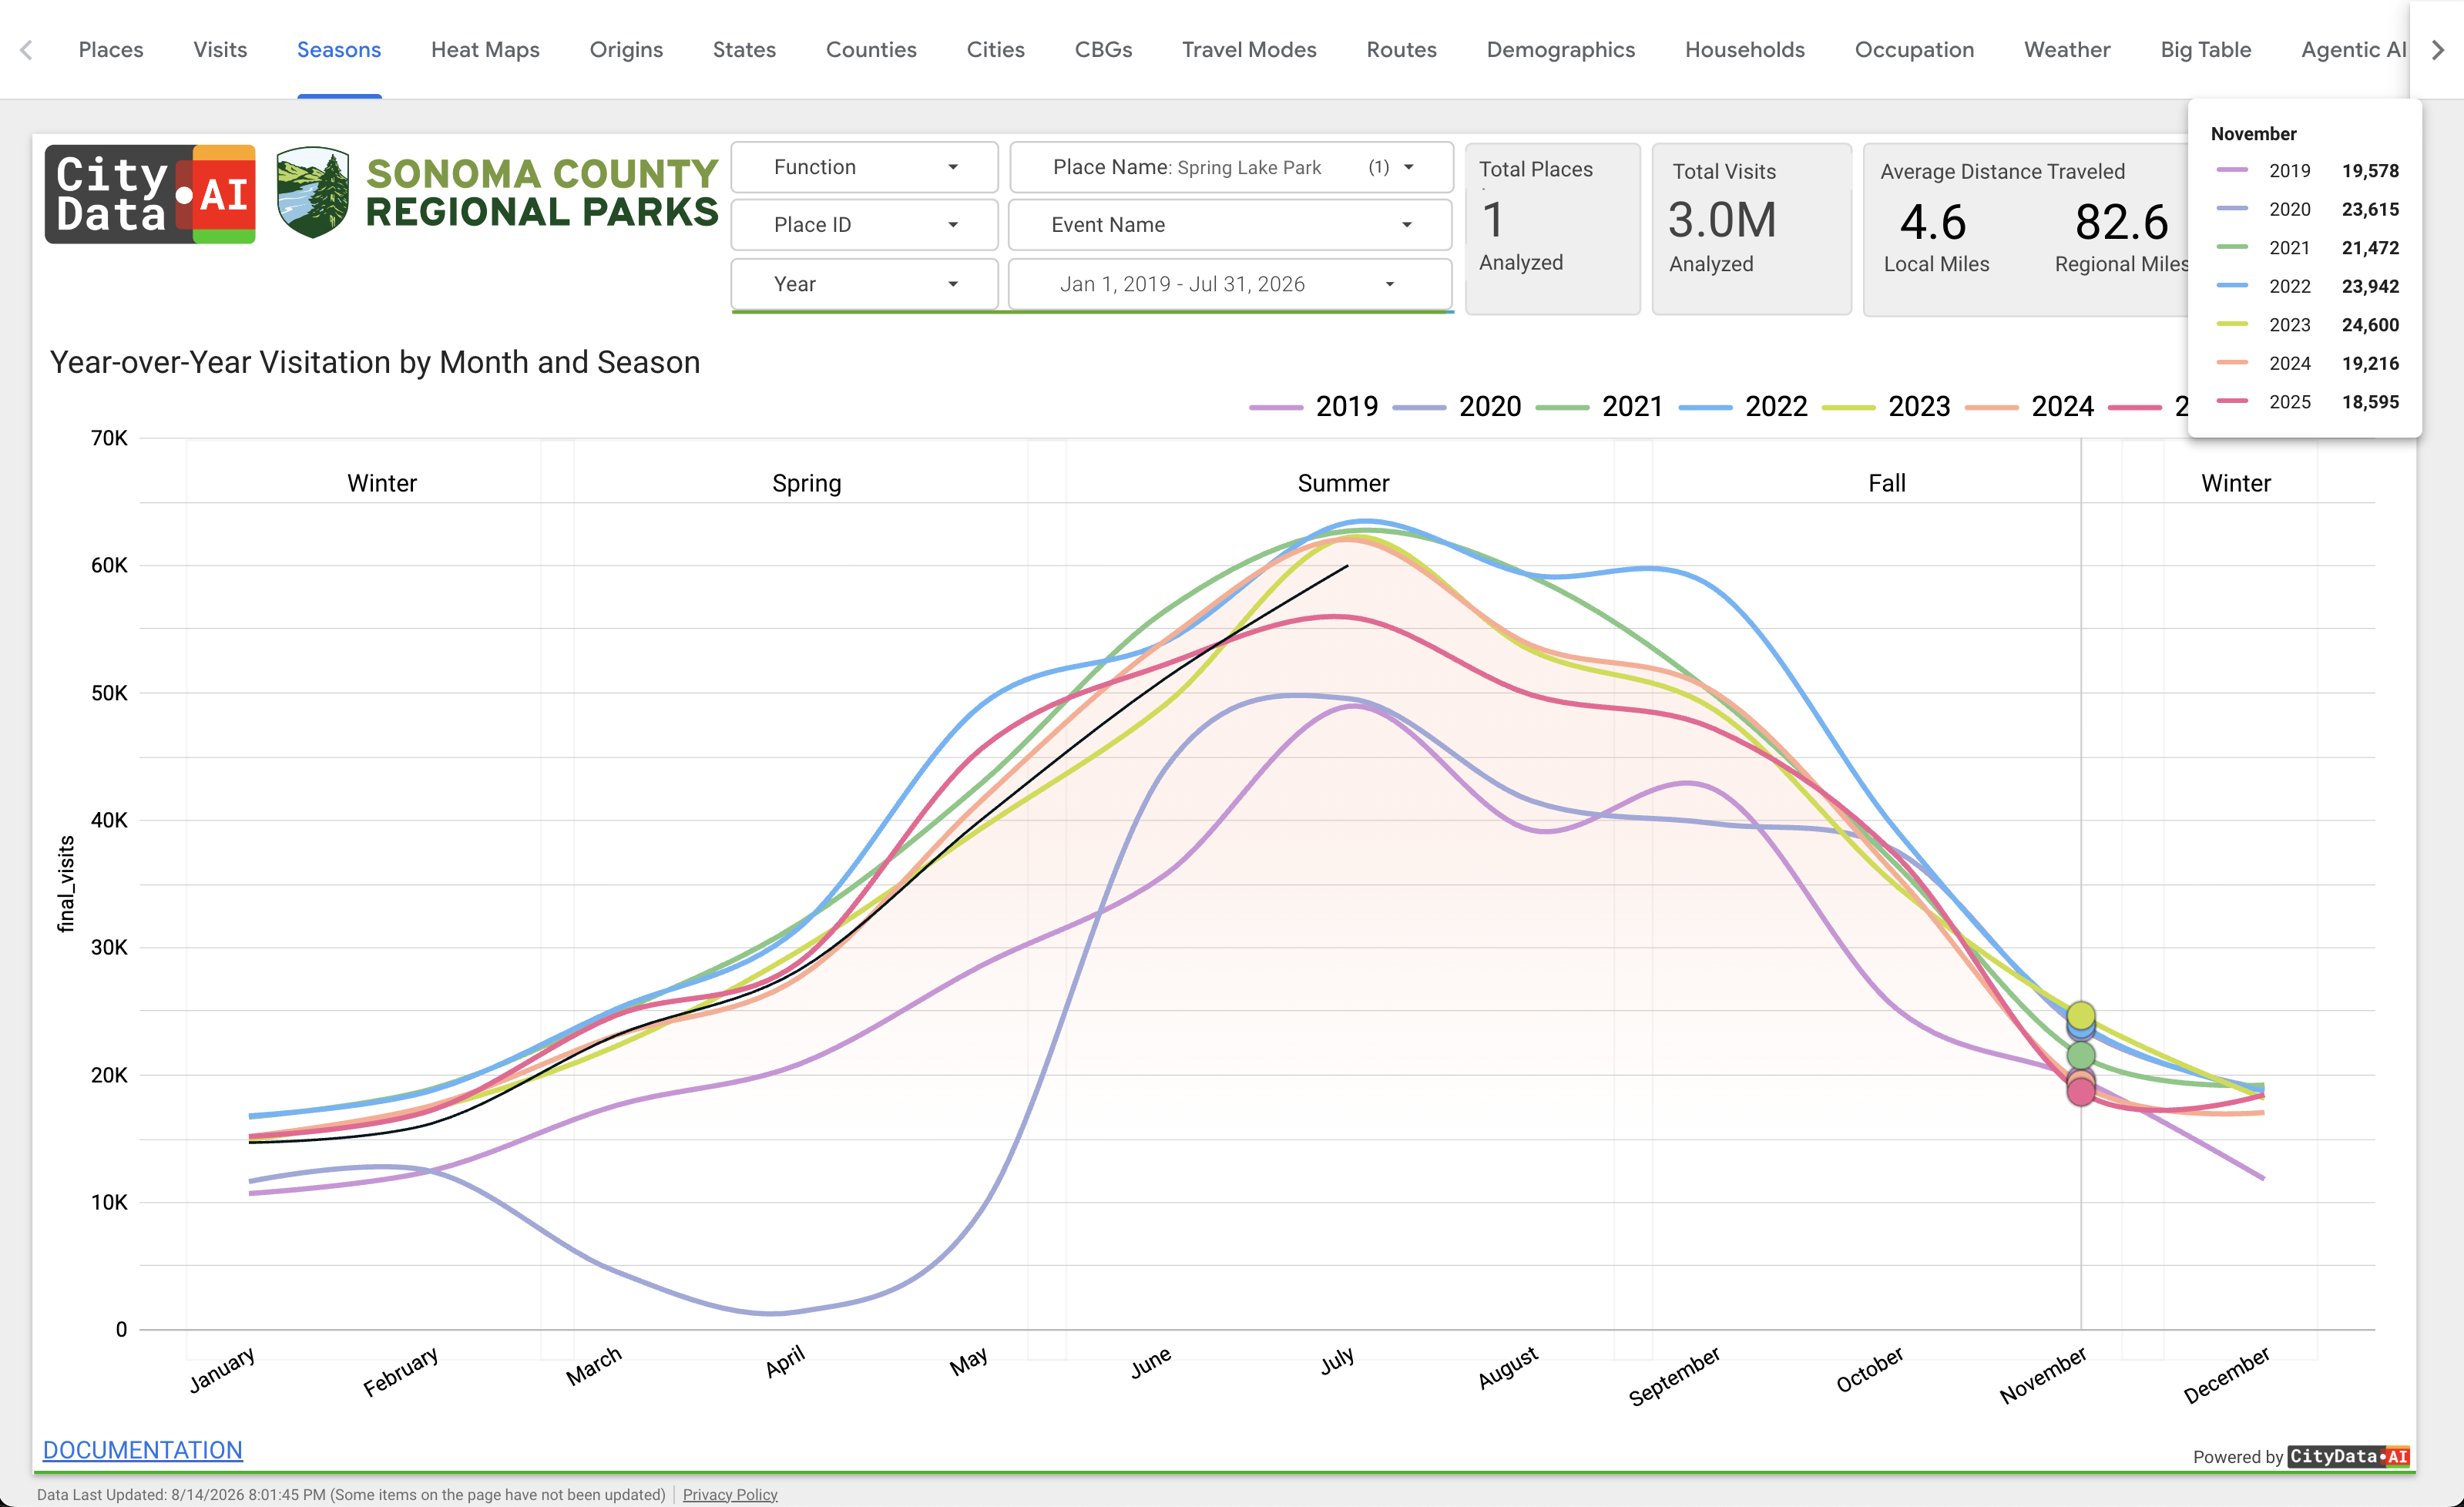
Seasonal Visitation Trends
See how visitation shifts across spring, summer, fall, and winter, so you can plan staffing, programming, and maintenance around real demand.
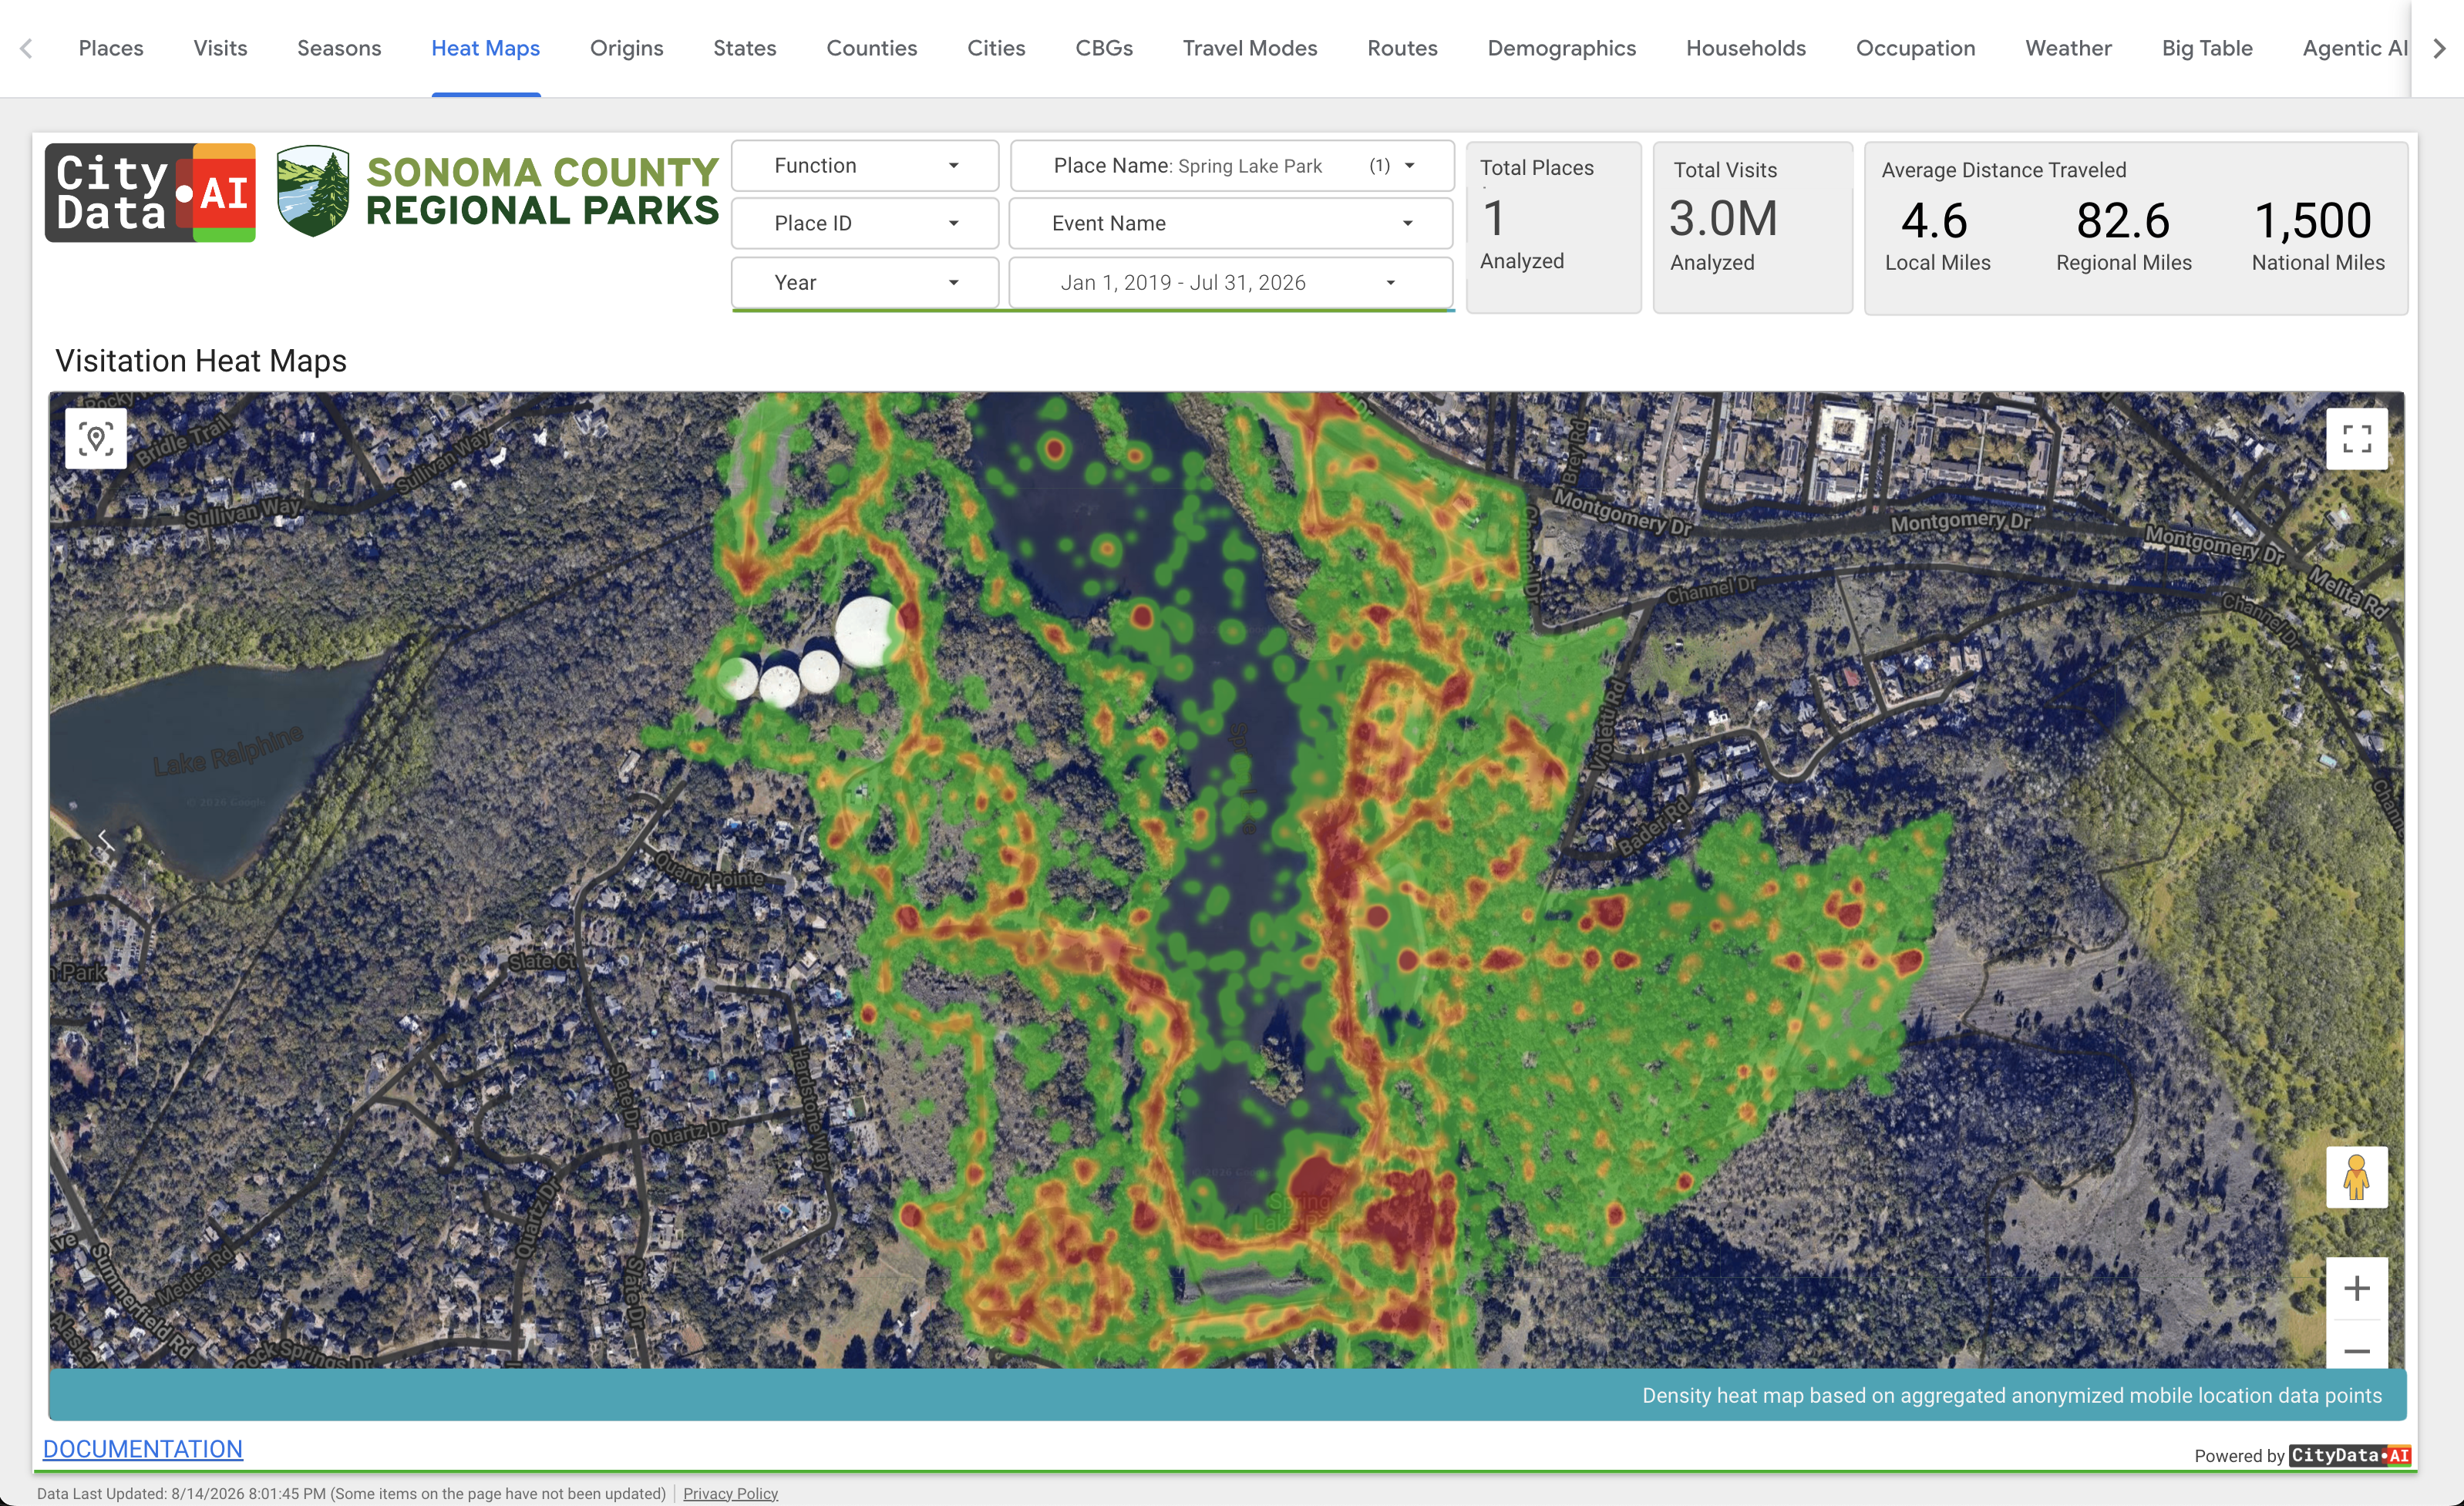
Activity Heat Maps
Heat maps show exactly where visitors concentrate within each park — which trails, fields, courts, and corners get the most use.
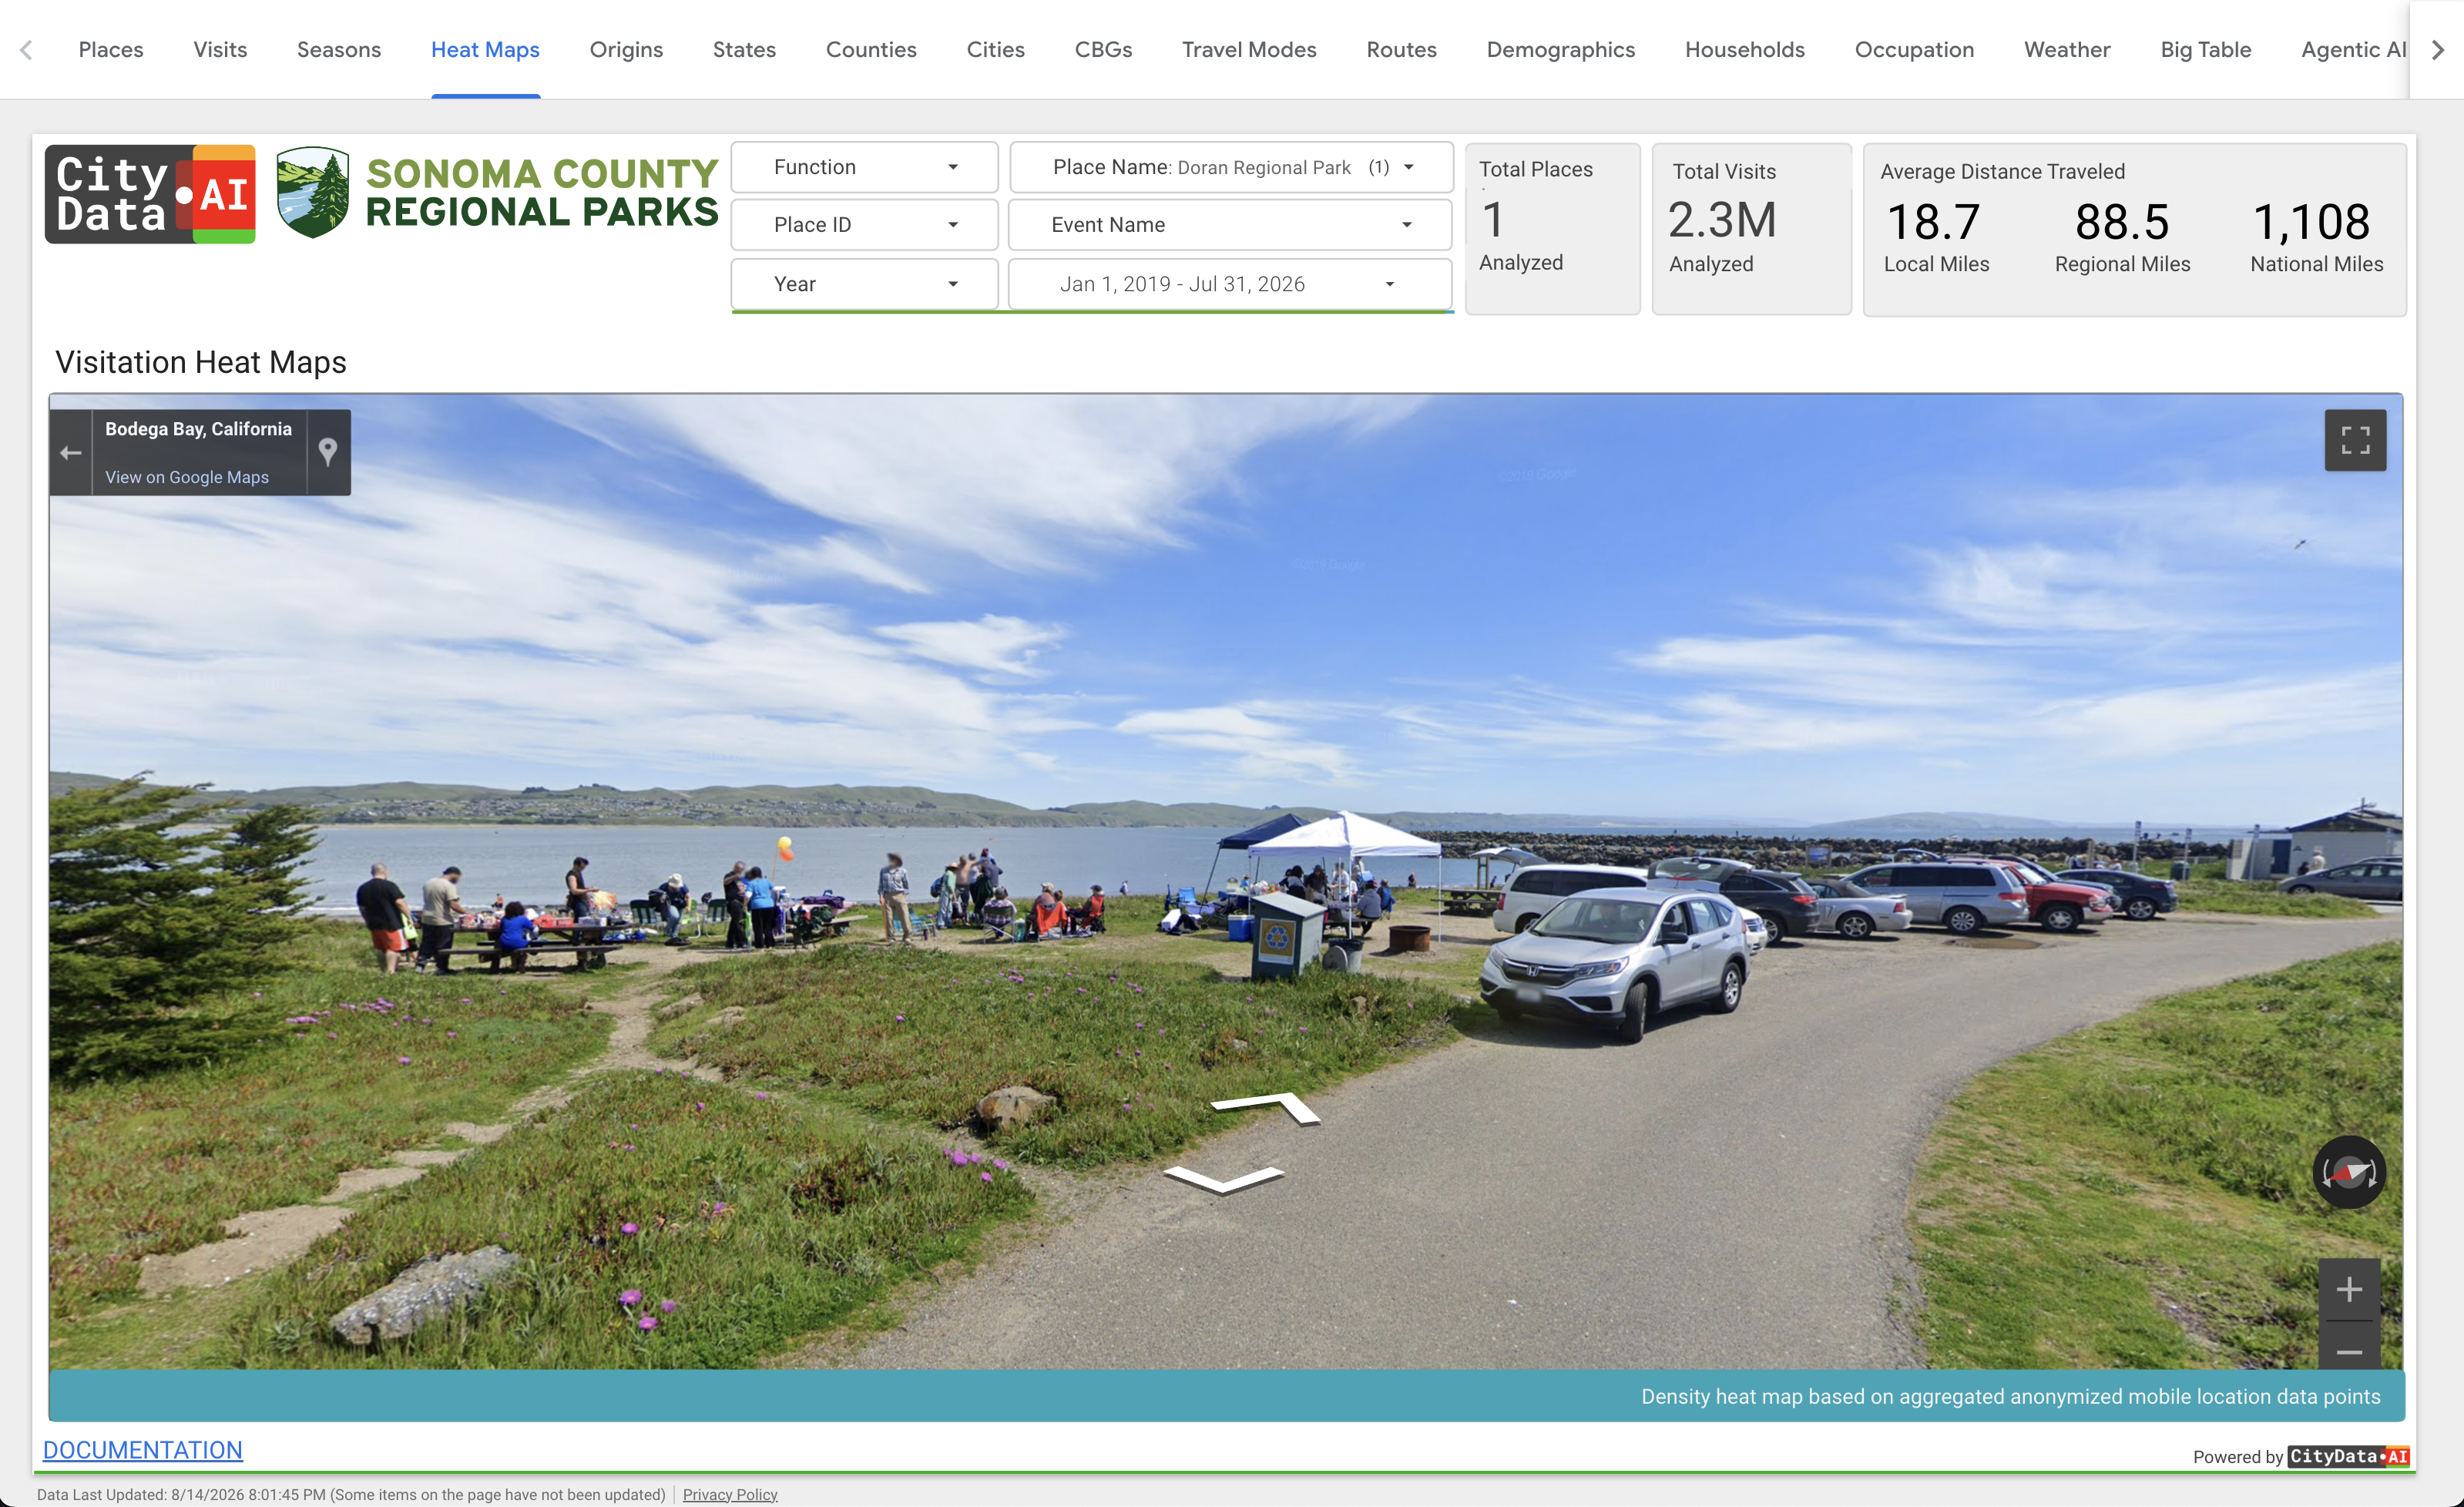
Google Street View
Jump from any place on the map straight into Google Street View to see entrances, trailheads, and facilities at eye level.
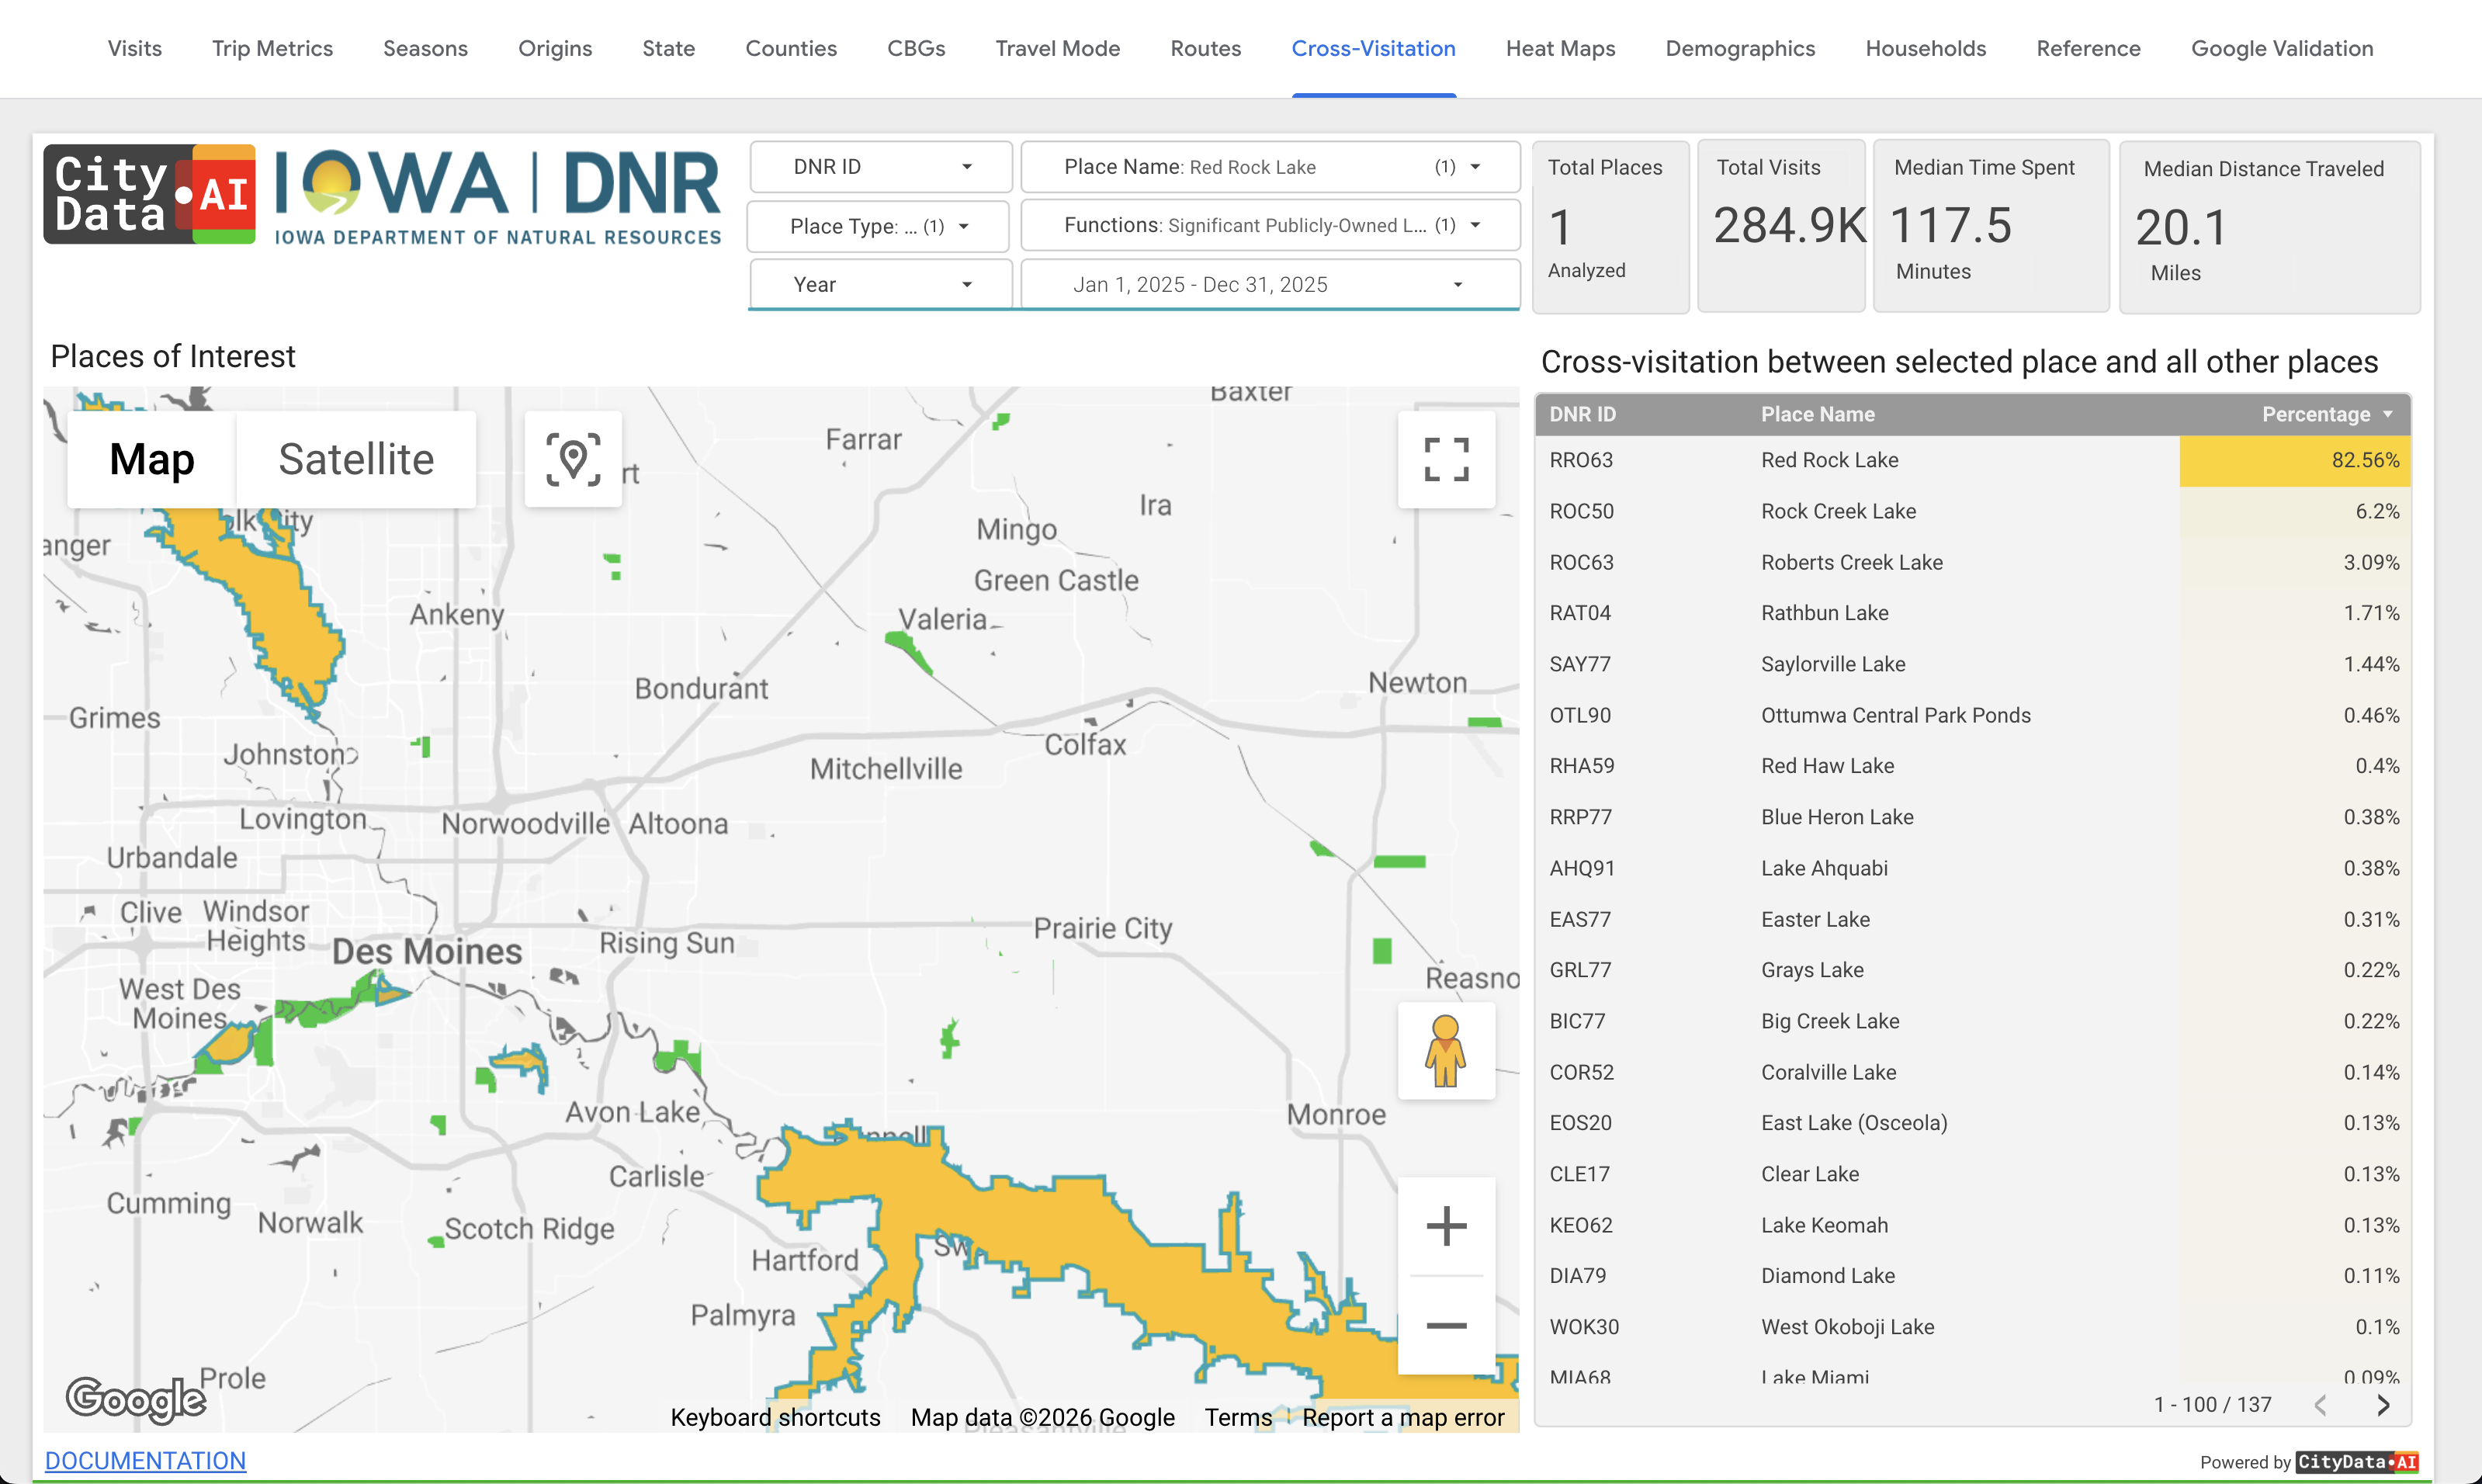
Cross Visitation
Discover which other parks and facilities your visitors also use — understand substitution, coverage gaps, and your system as a network.
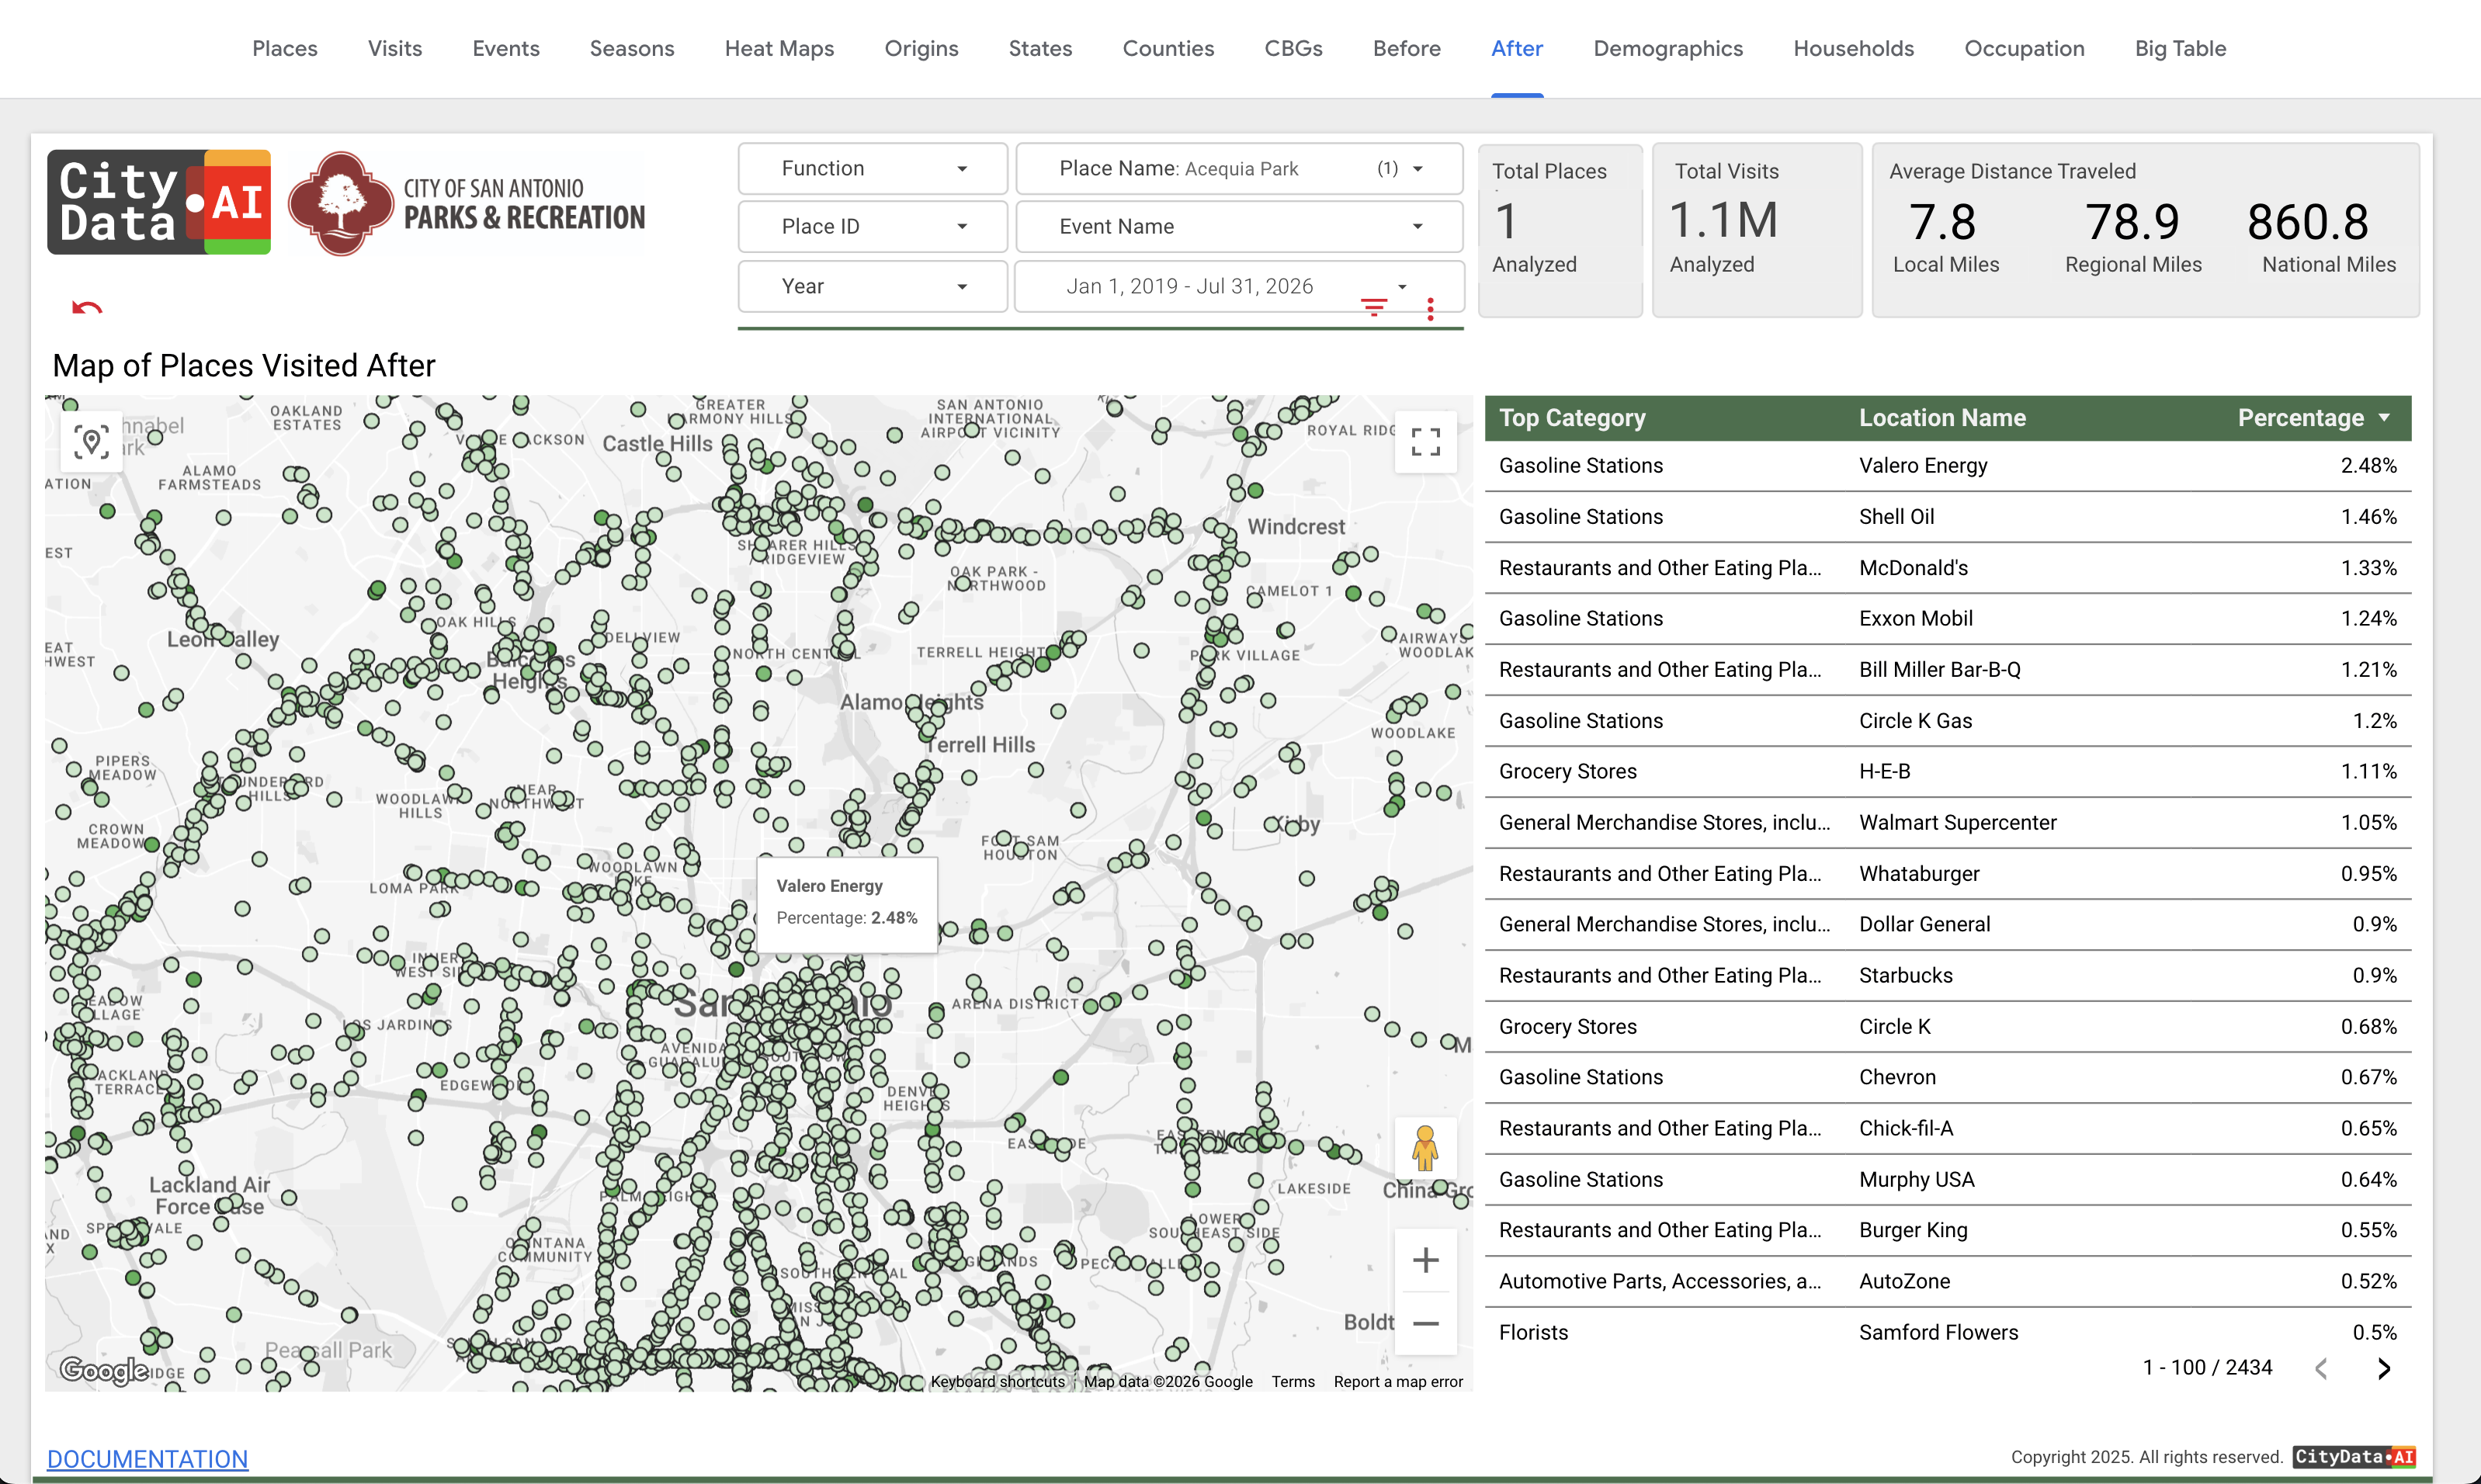
Before and After
Understand the consumer journey with a comprehensive list of places that people visited before and after they visited your park, trail or open space.
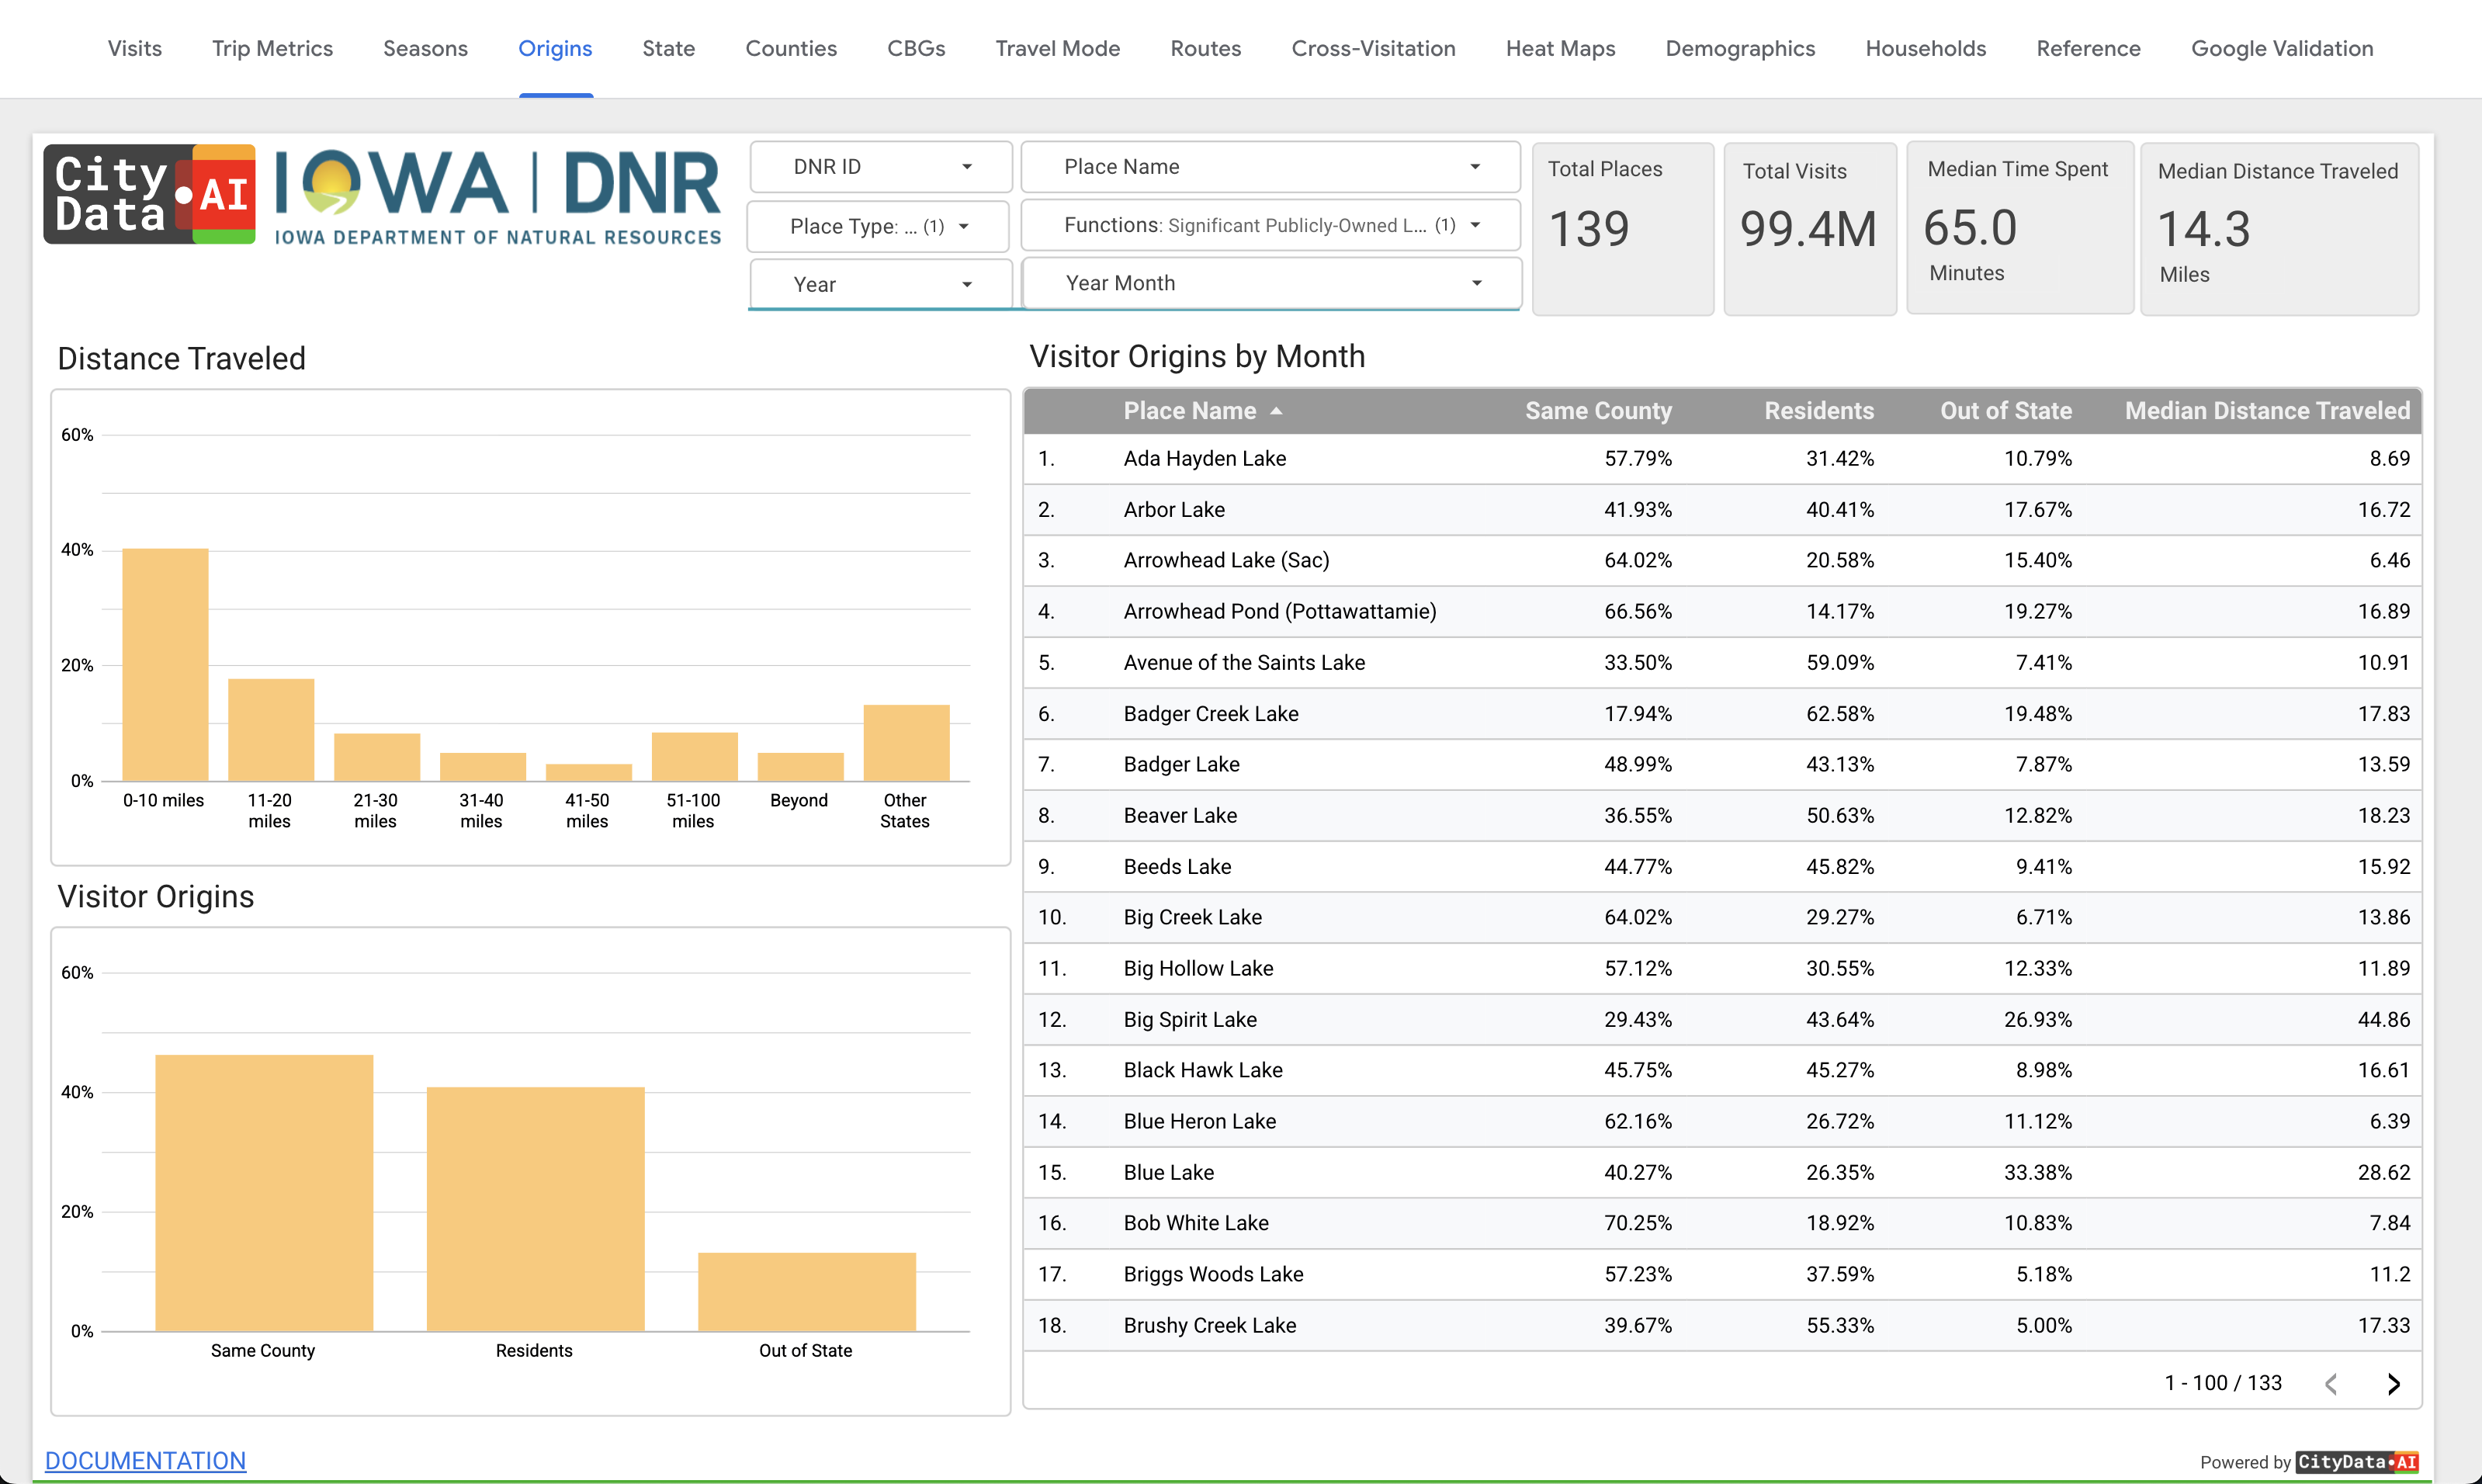
Visitor Origins
See where park visitors come from and how far they travel, to understand your true service area and plan outreach where it matters.
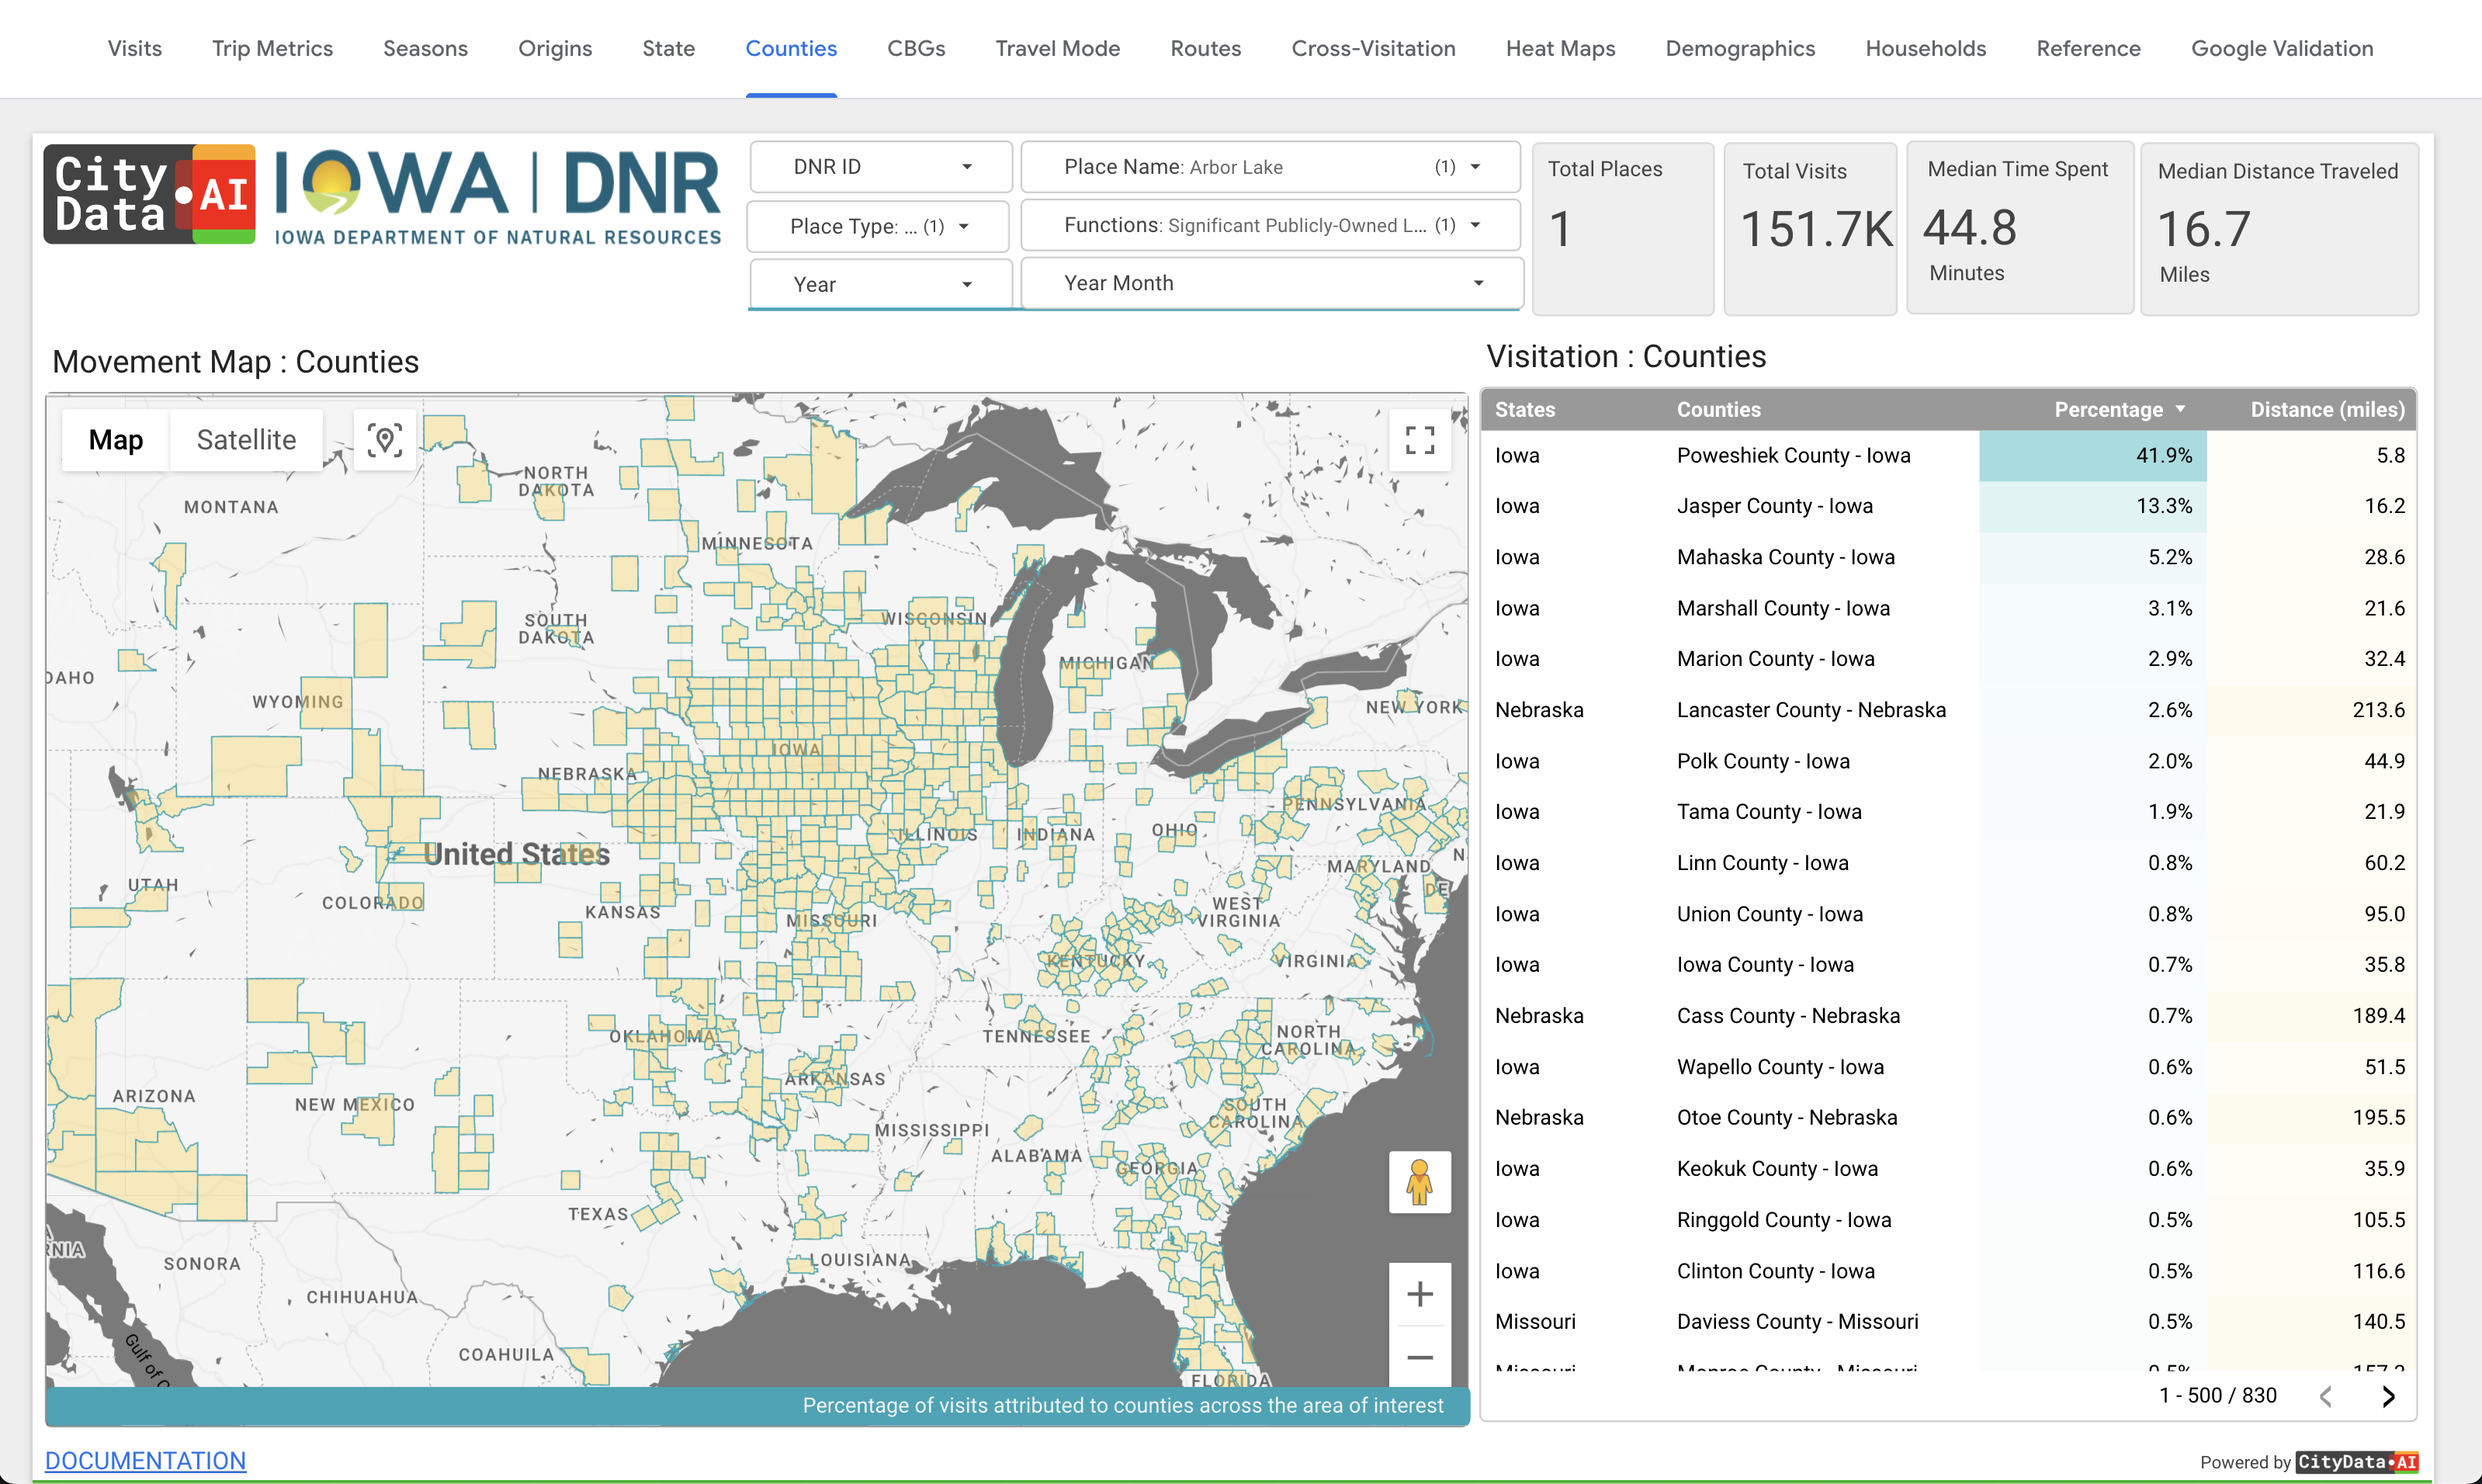
Origin Counties
Visitor origins rolled up by home county — instantly separate local residents from regional and out-of-town visitors.
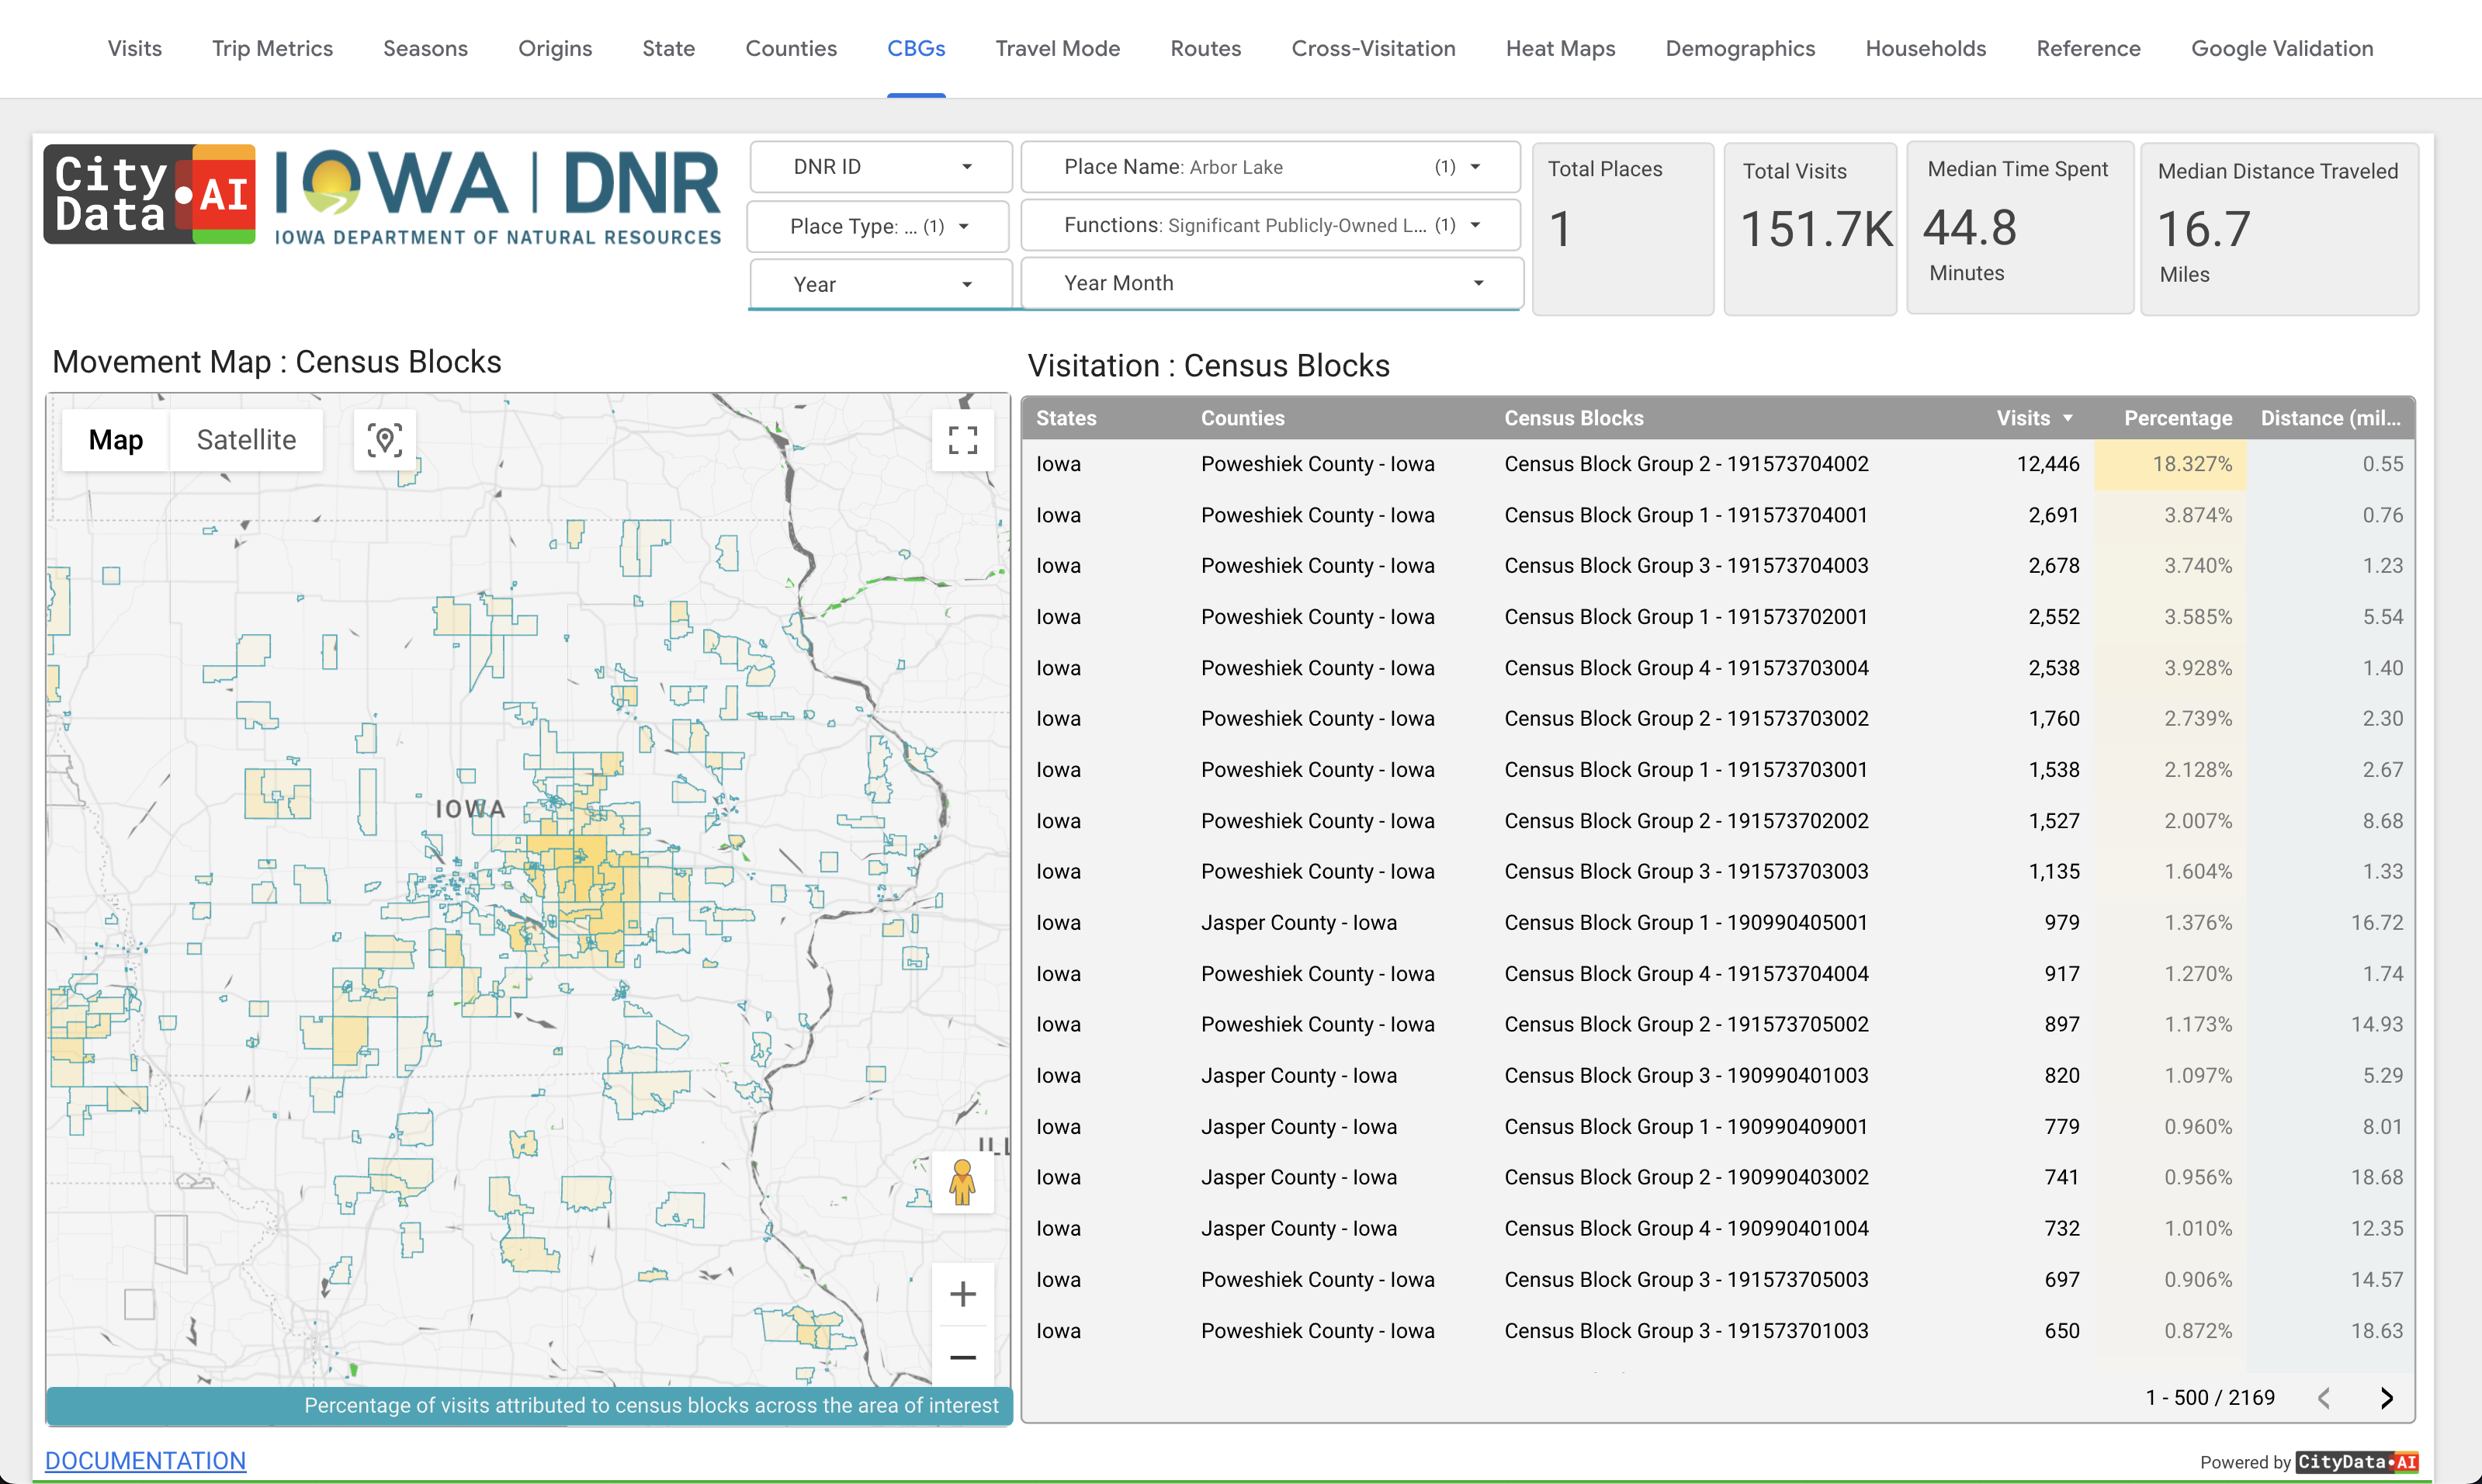
Origin Census Block
Origins at census block group resolution for fine-grained equity analysis — know which neighborhoods your parks serve and which they miss.
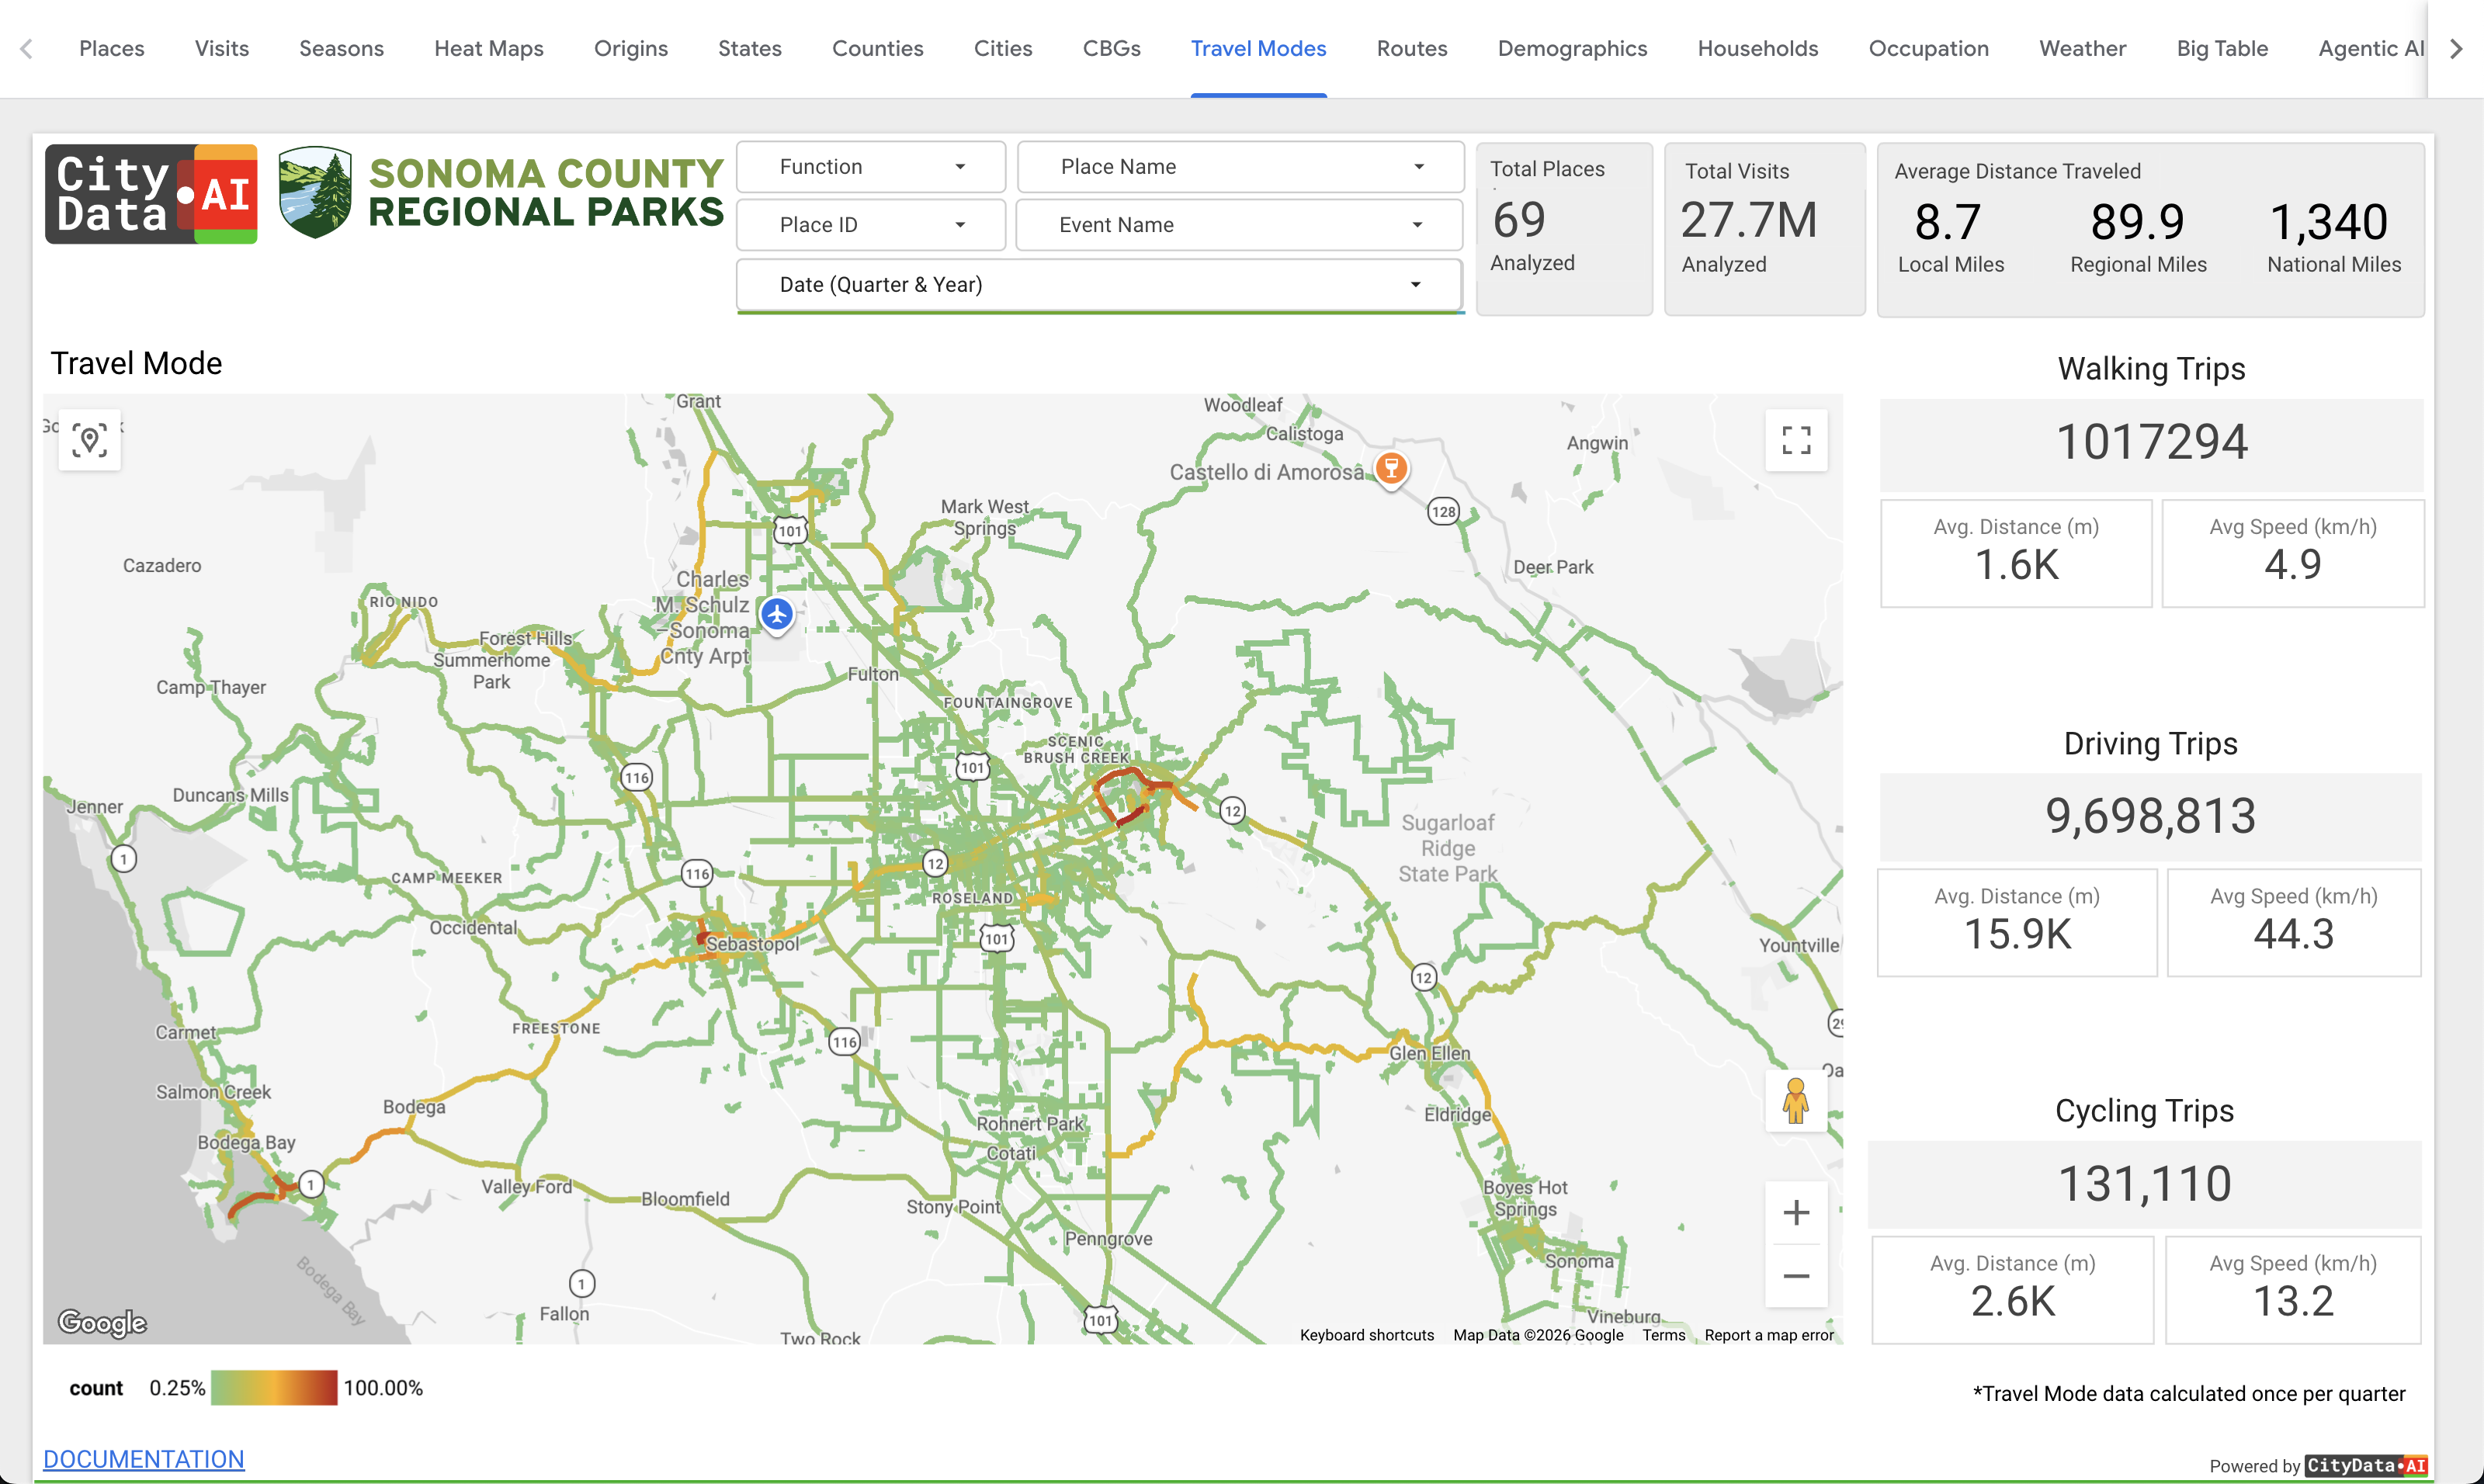
Visitor Travel Modes
Understand how people reach your parks — walking, cycling, driving, or transit — and plan parking, paths, and access accordingly.
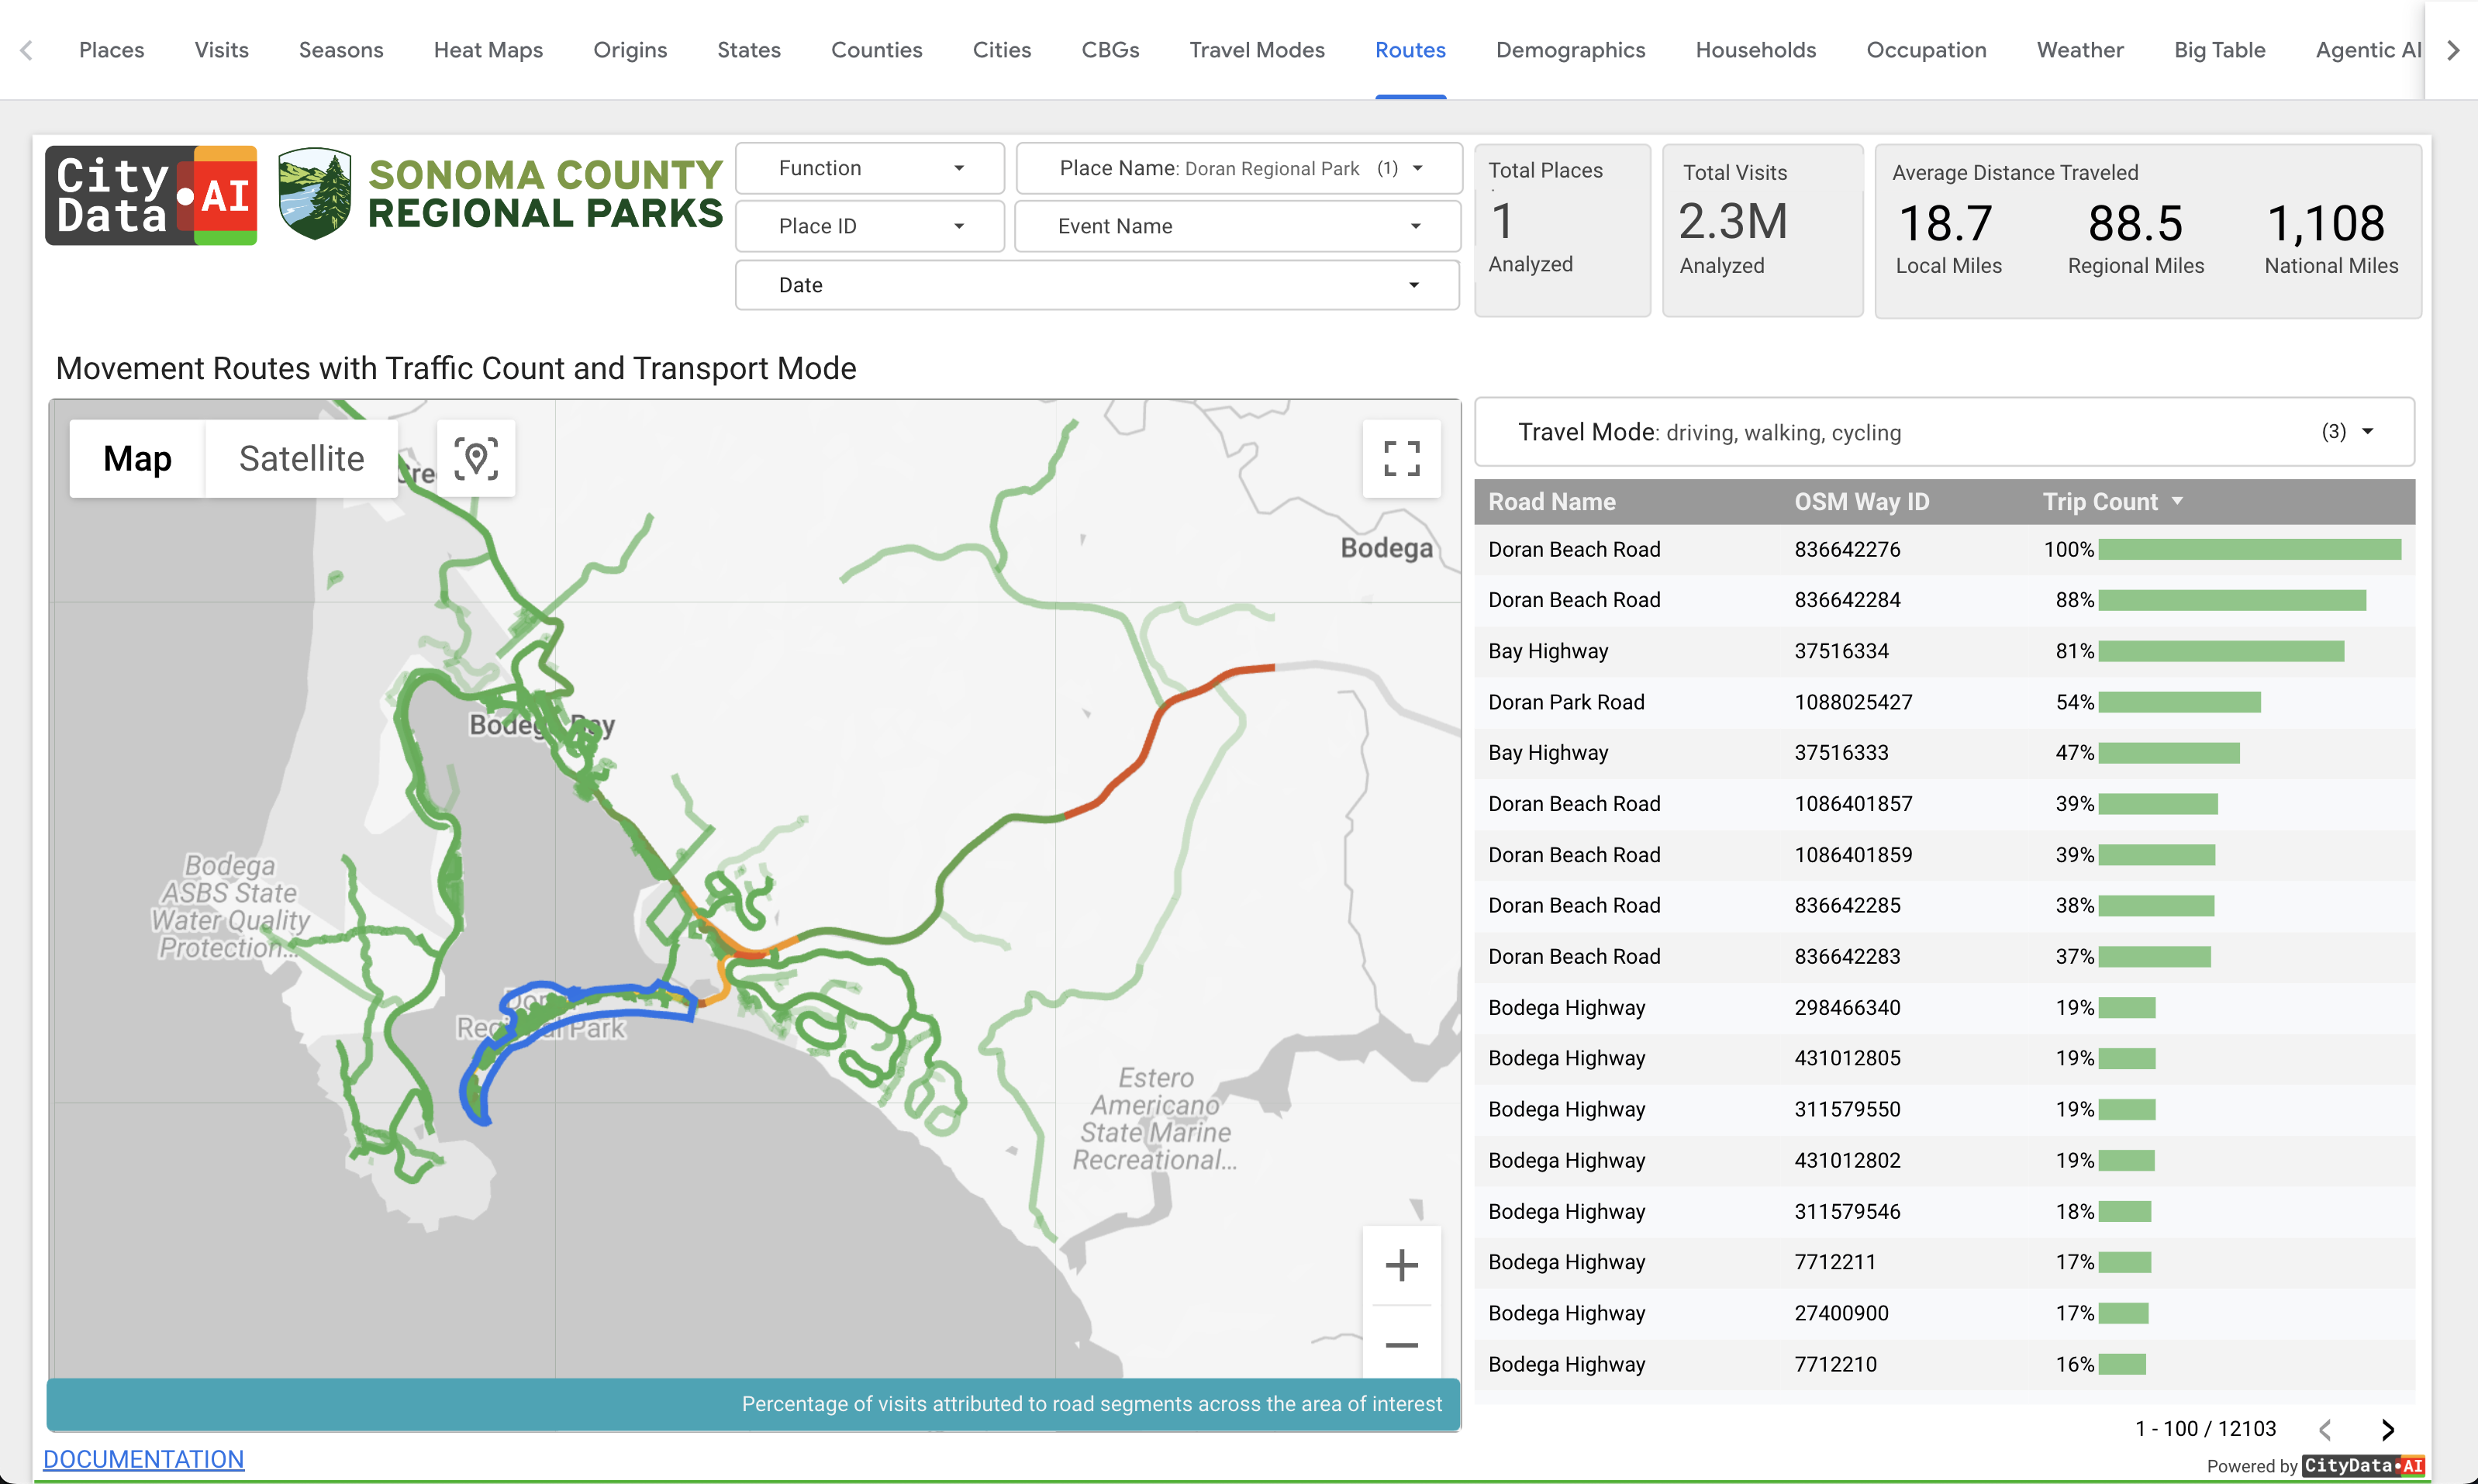
Visitor Travel Routes
See the routes visitors actually take to reach your parks and trails, to guide wayfinding, safety improvements, and access investments.
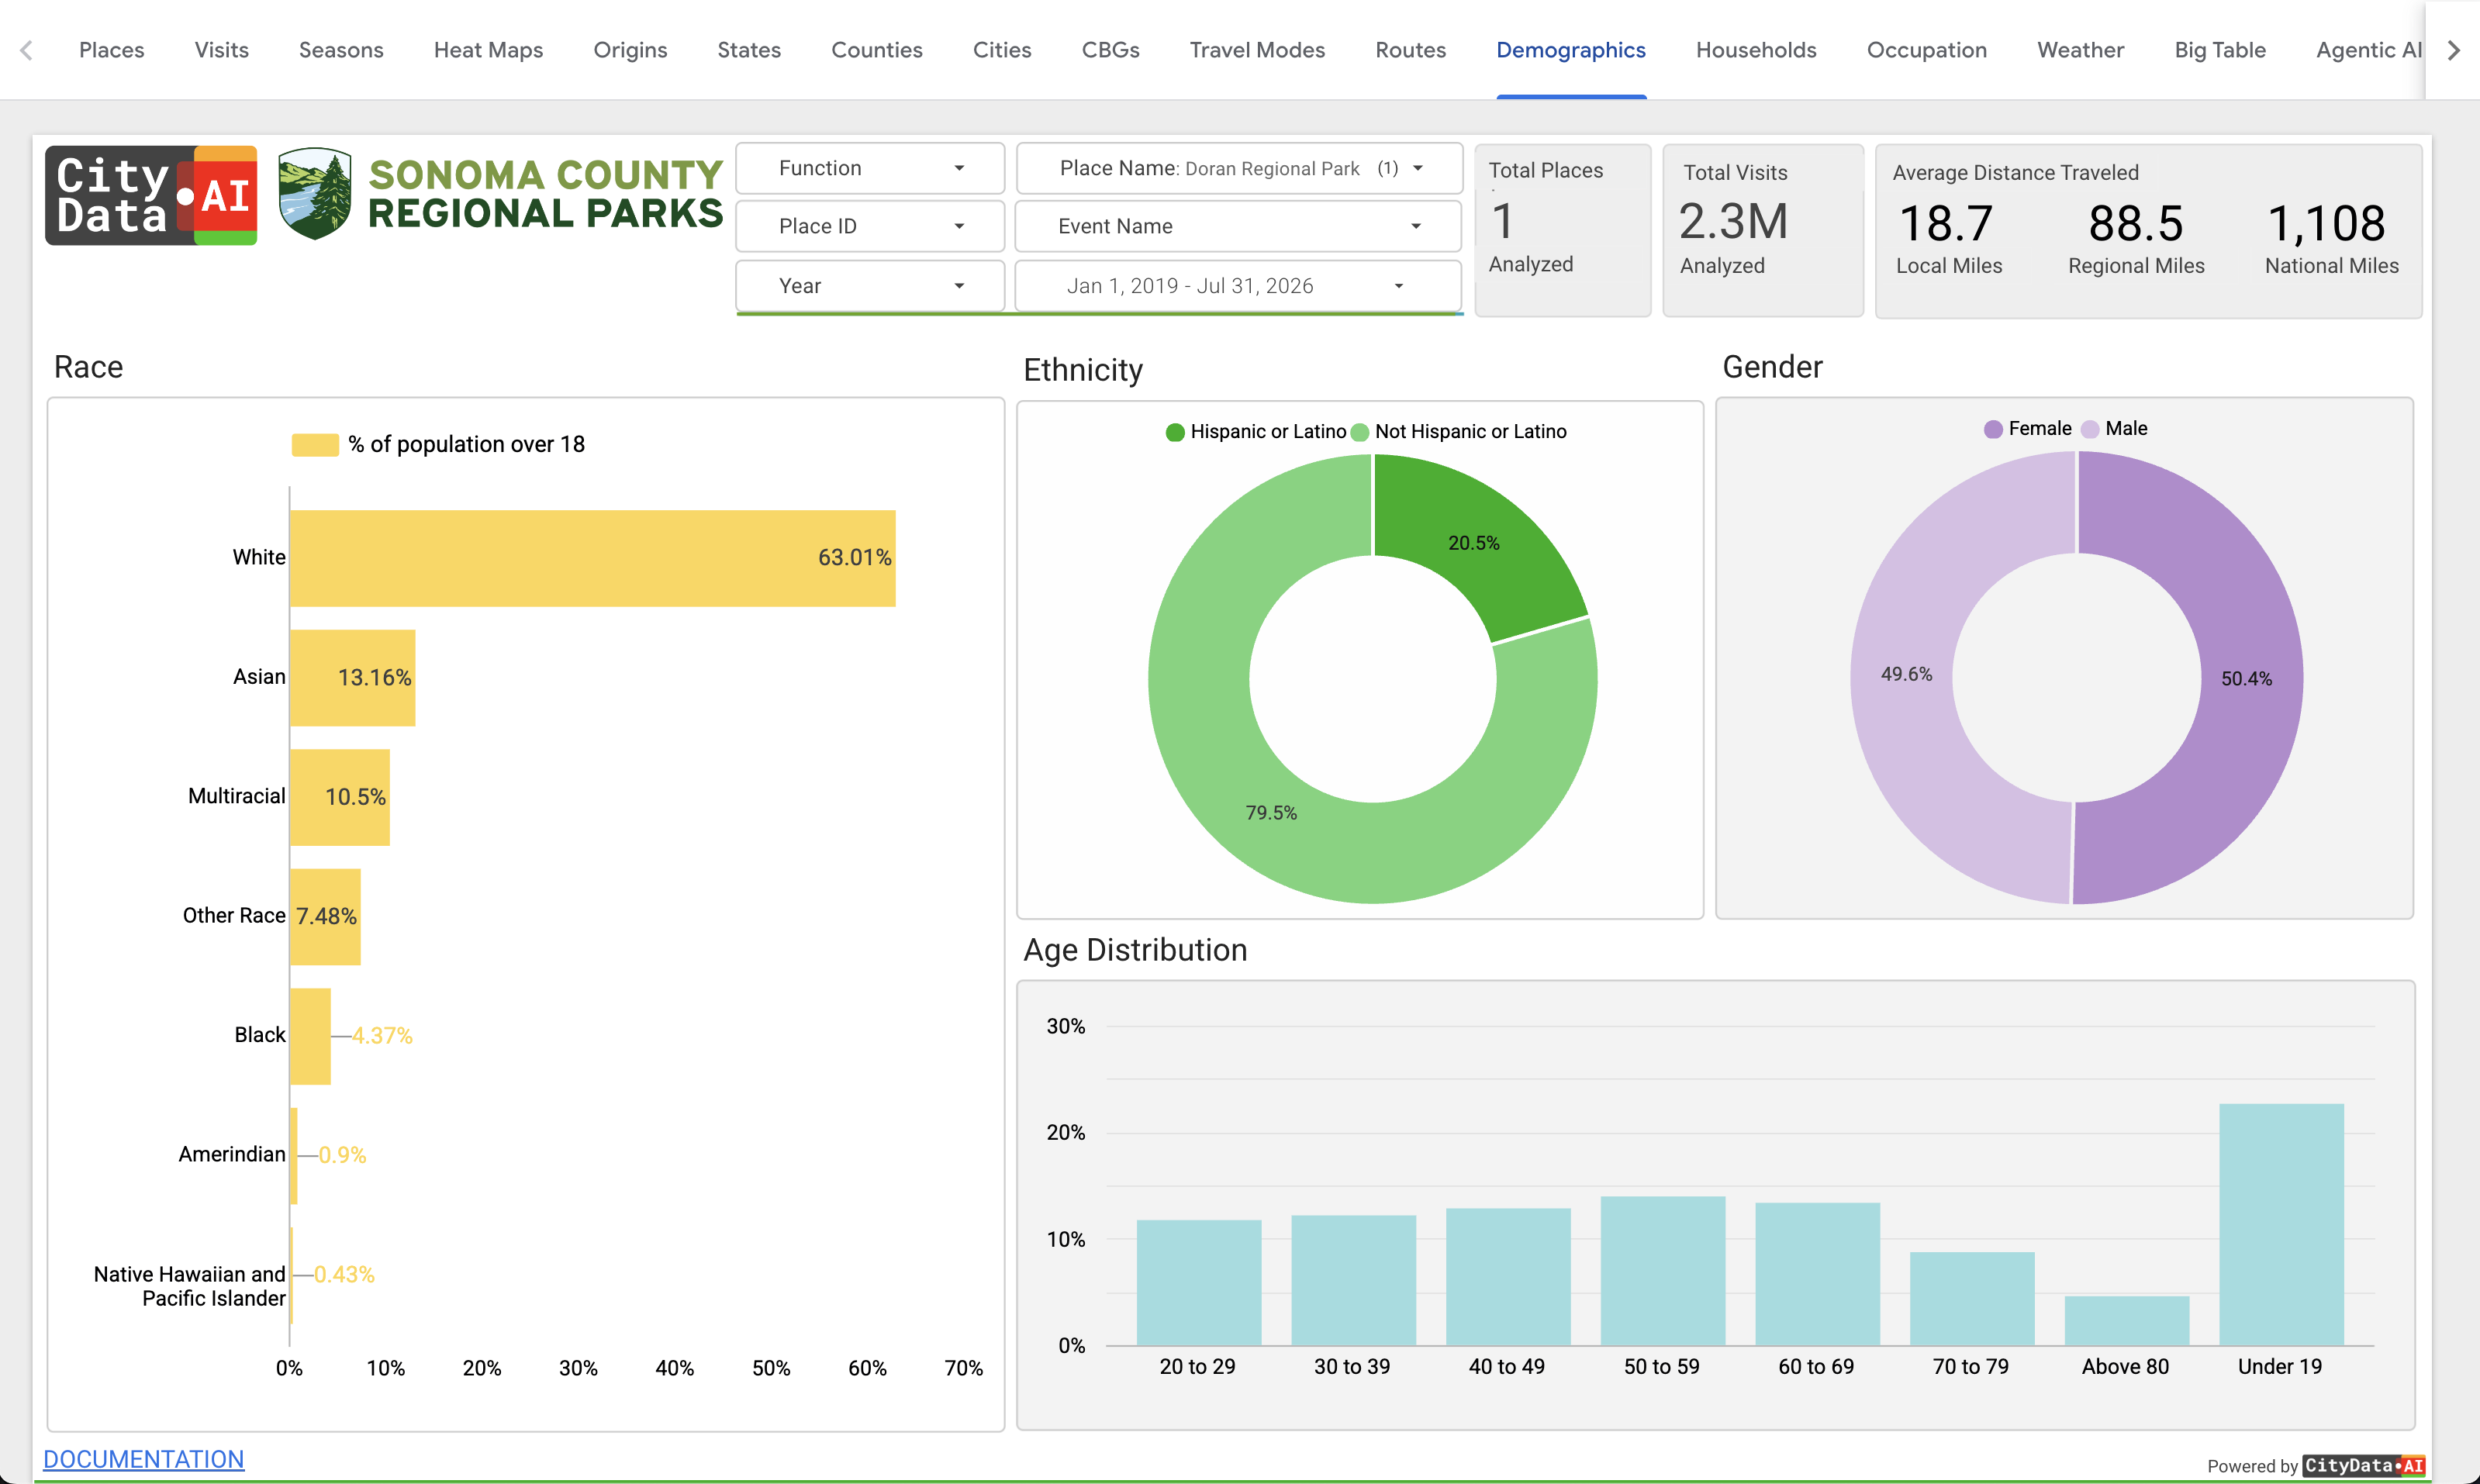
Visitor Demographics
Anonymized, aggregated visitor profiles — age, income, and education — so you know who your parks serve today and who is missing.
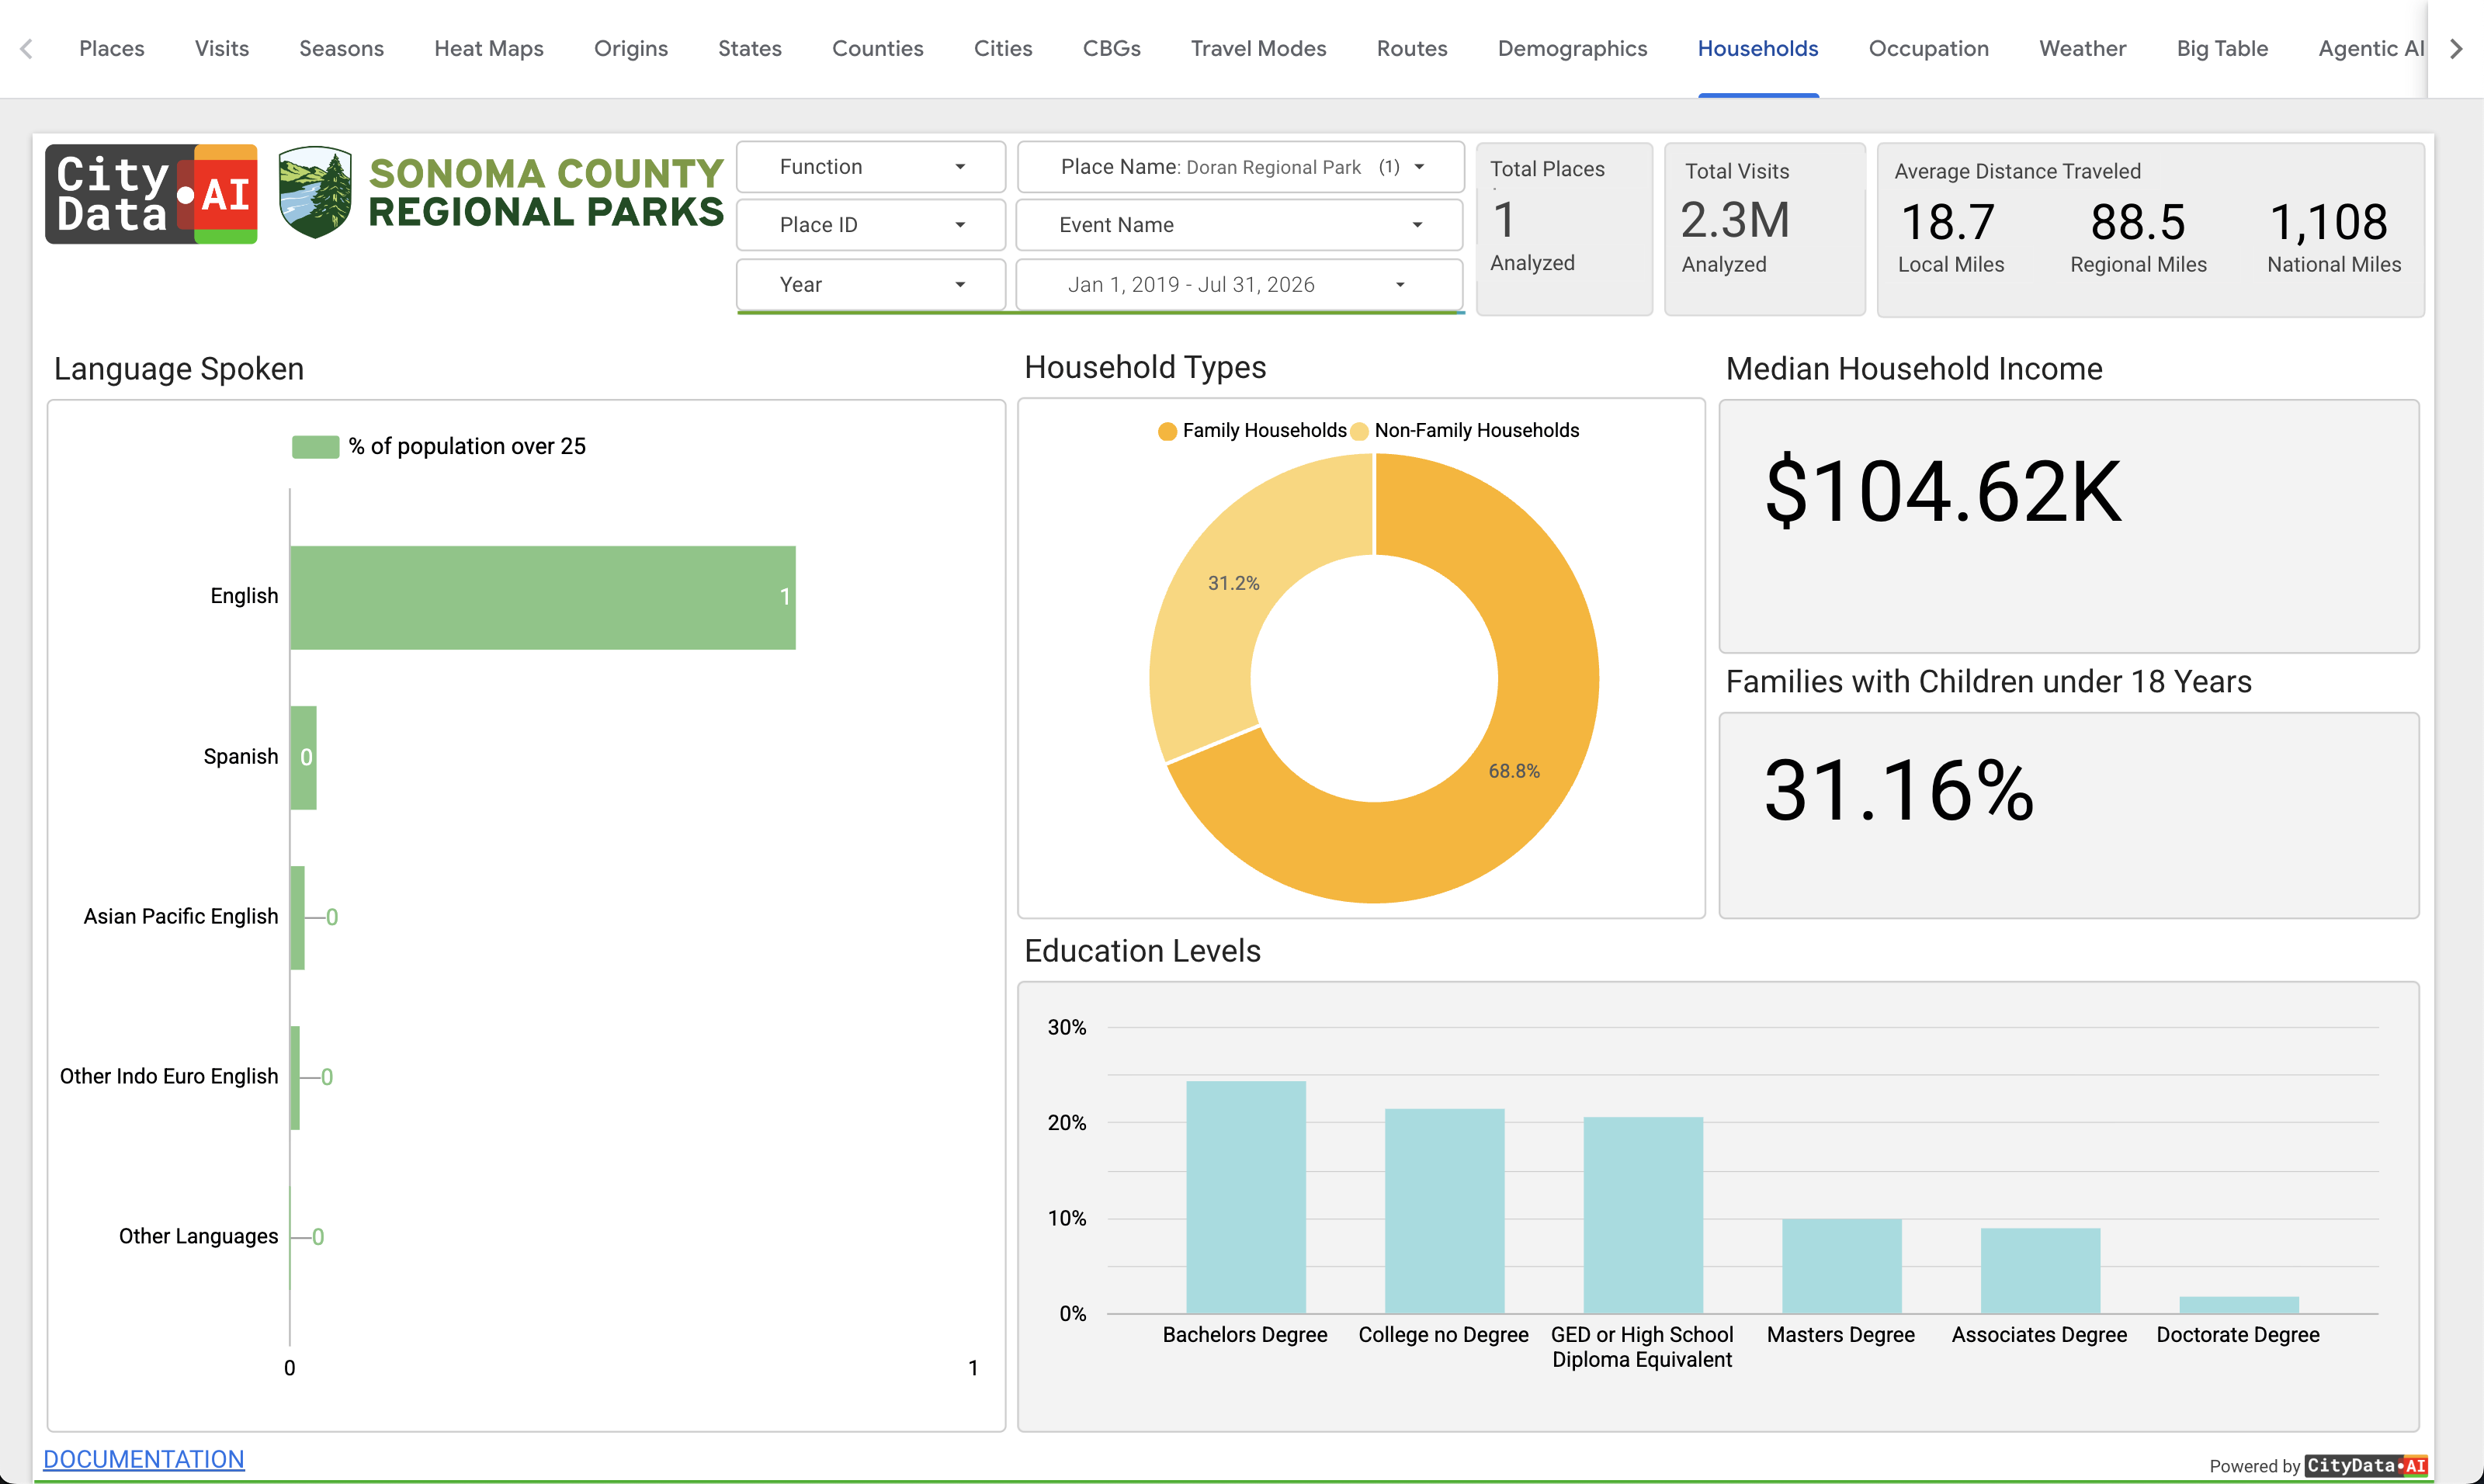
Visitor Households
Household composition of your visitors — families with children, seniors, singles — to shape programming that fits your community.
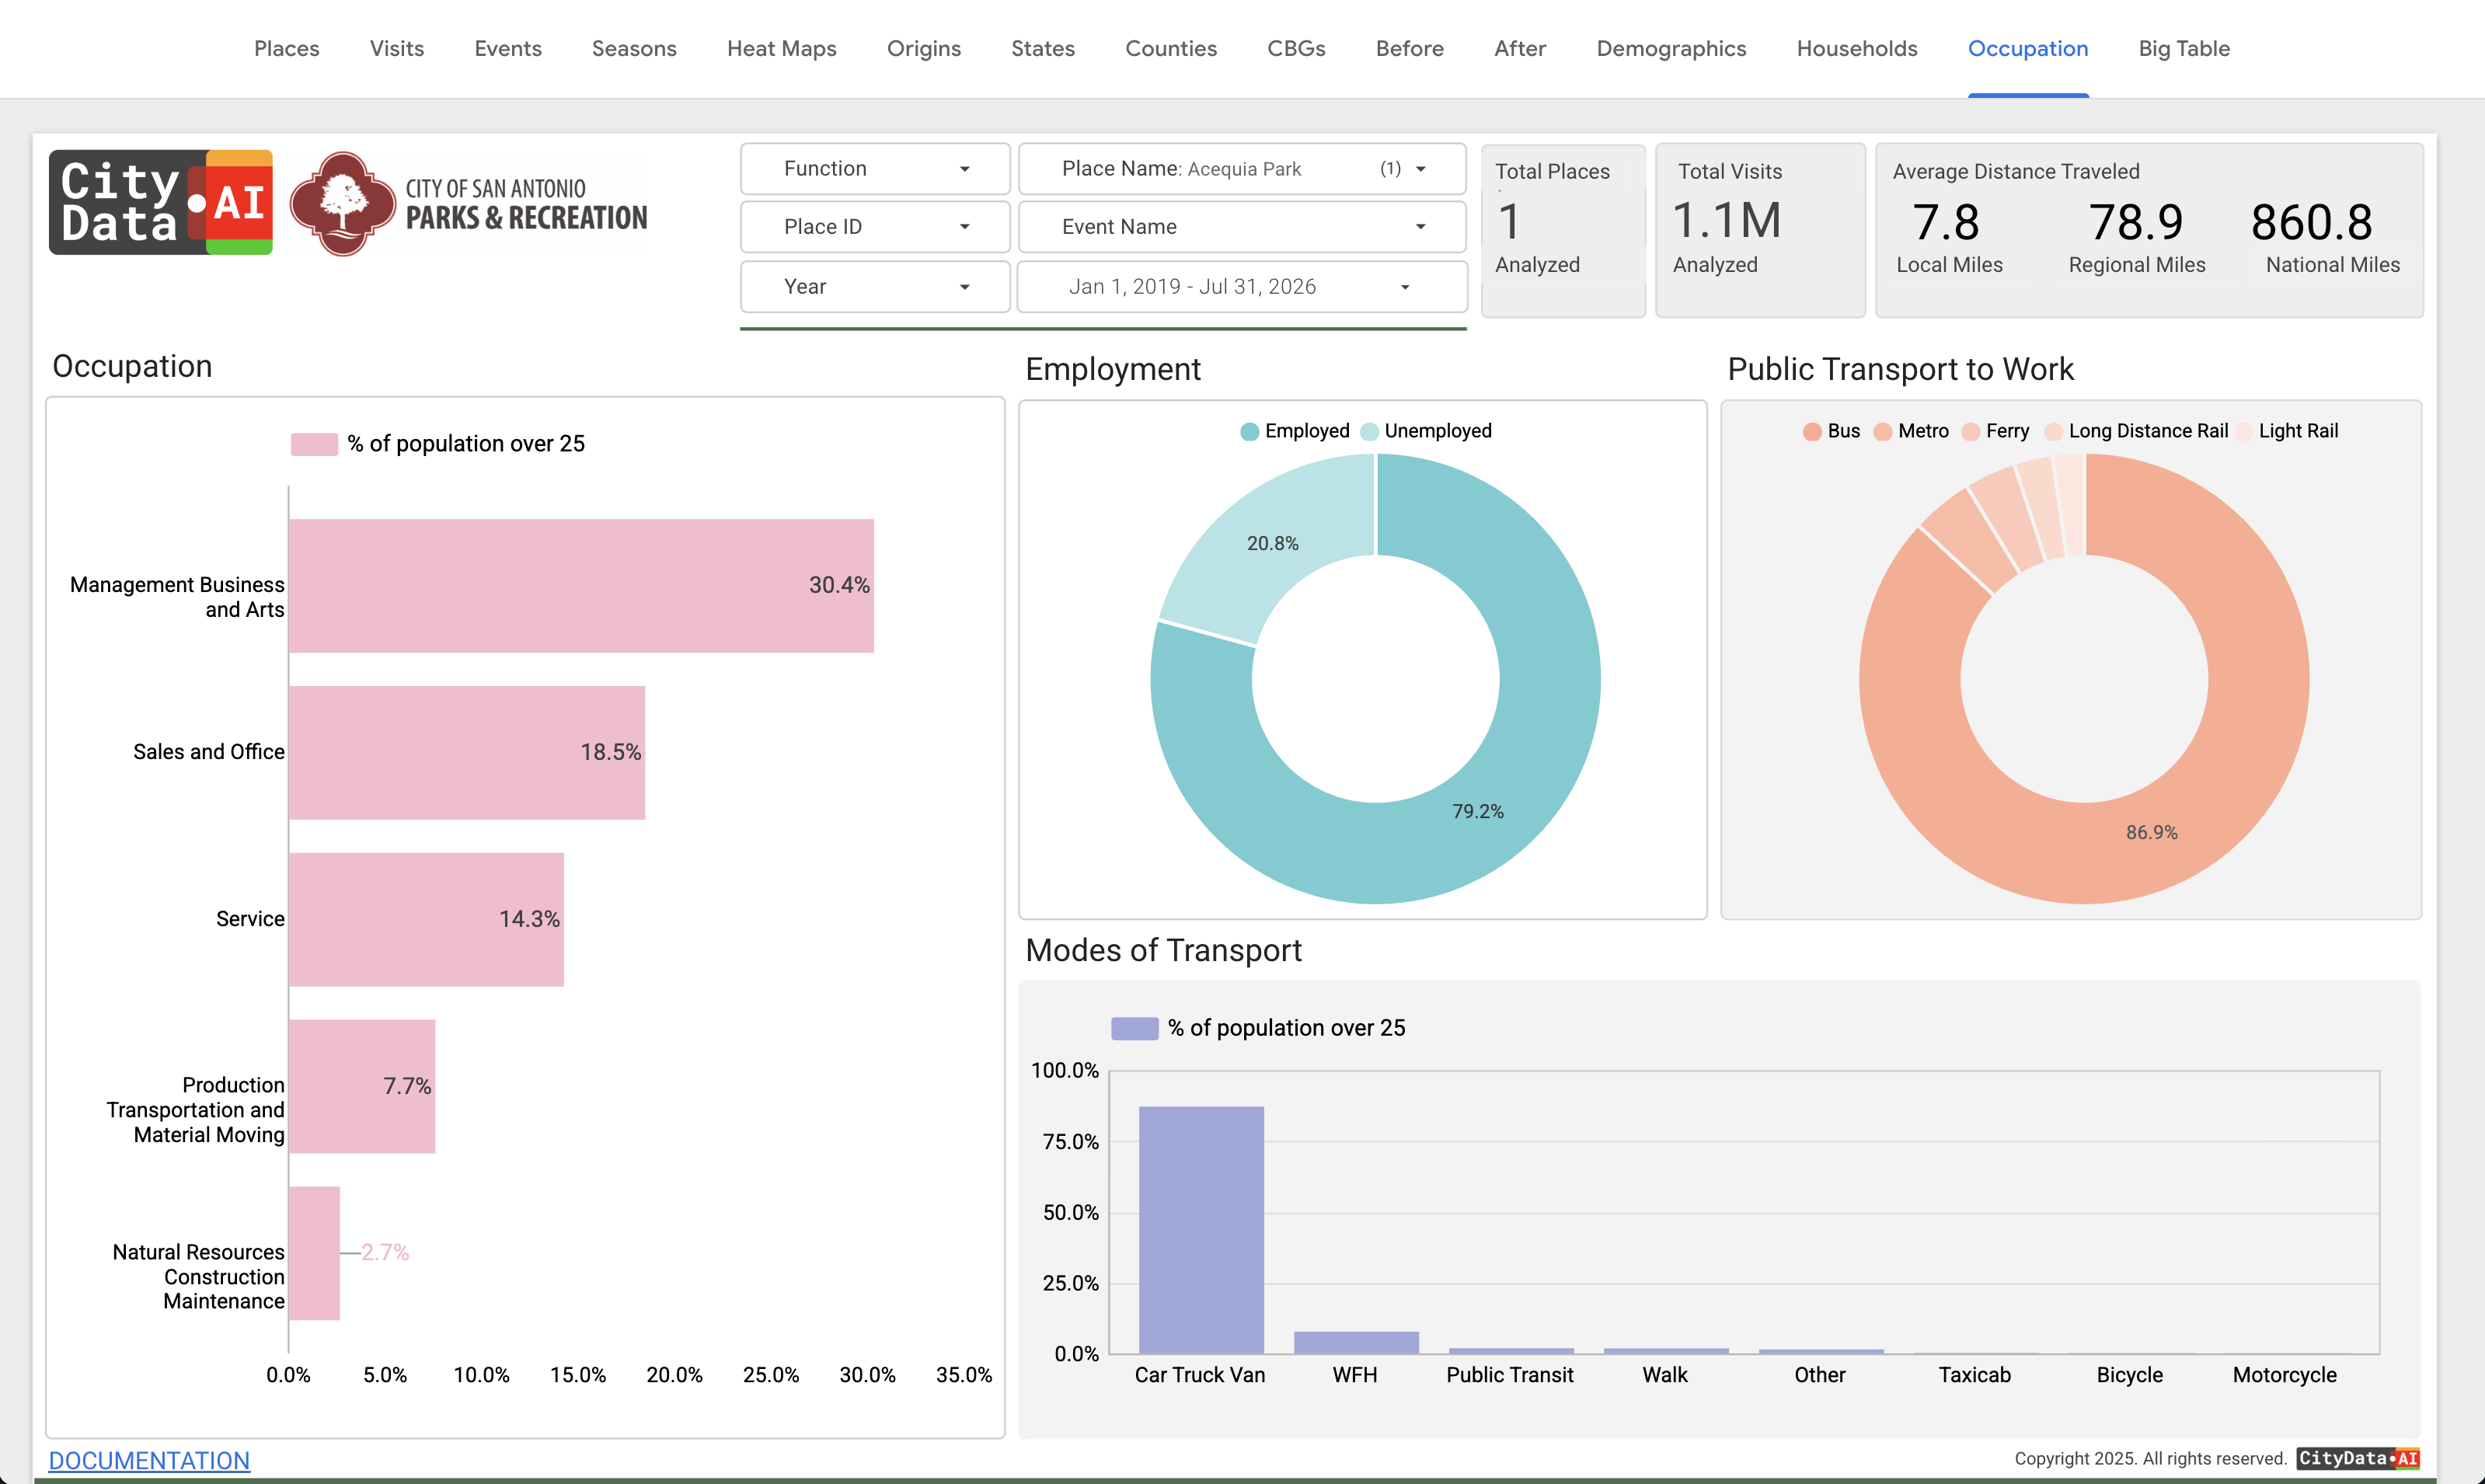
Visitor Occupation
Occupation segments of park visitors, adding another lens for programming, partnerships, and sponsorship conversations.
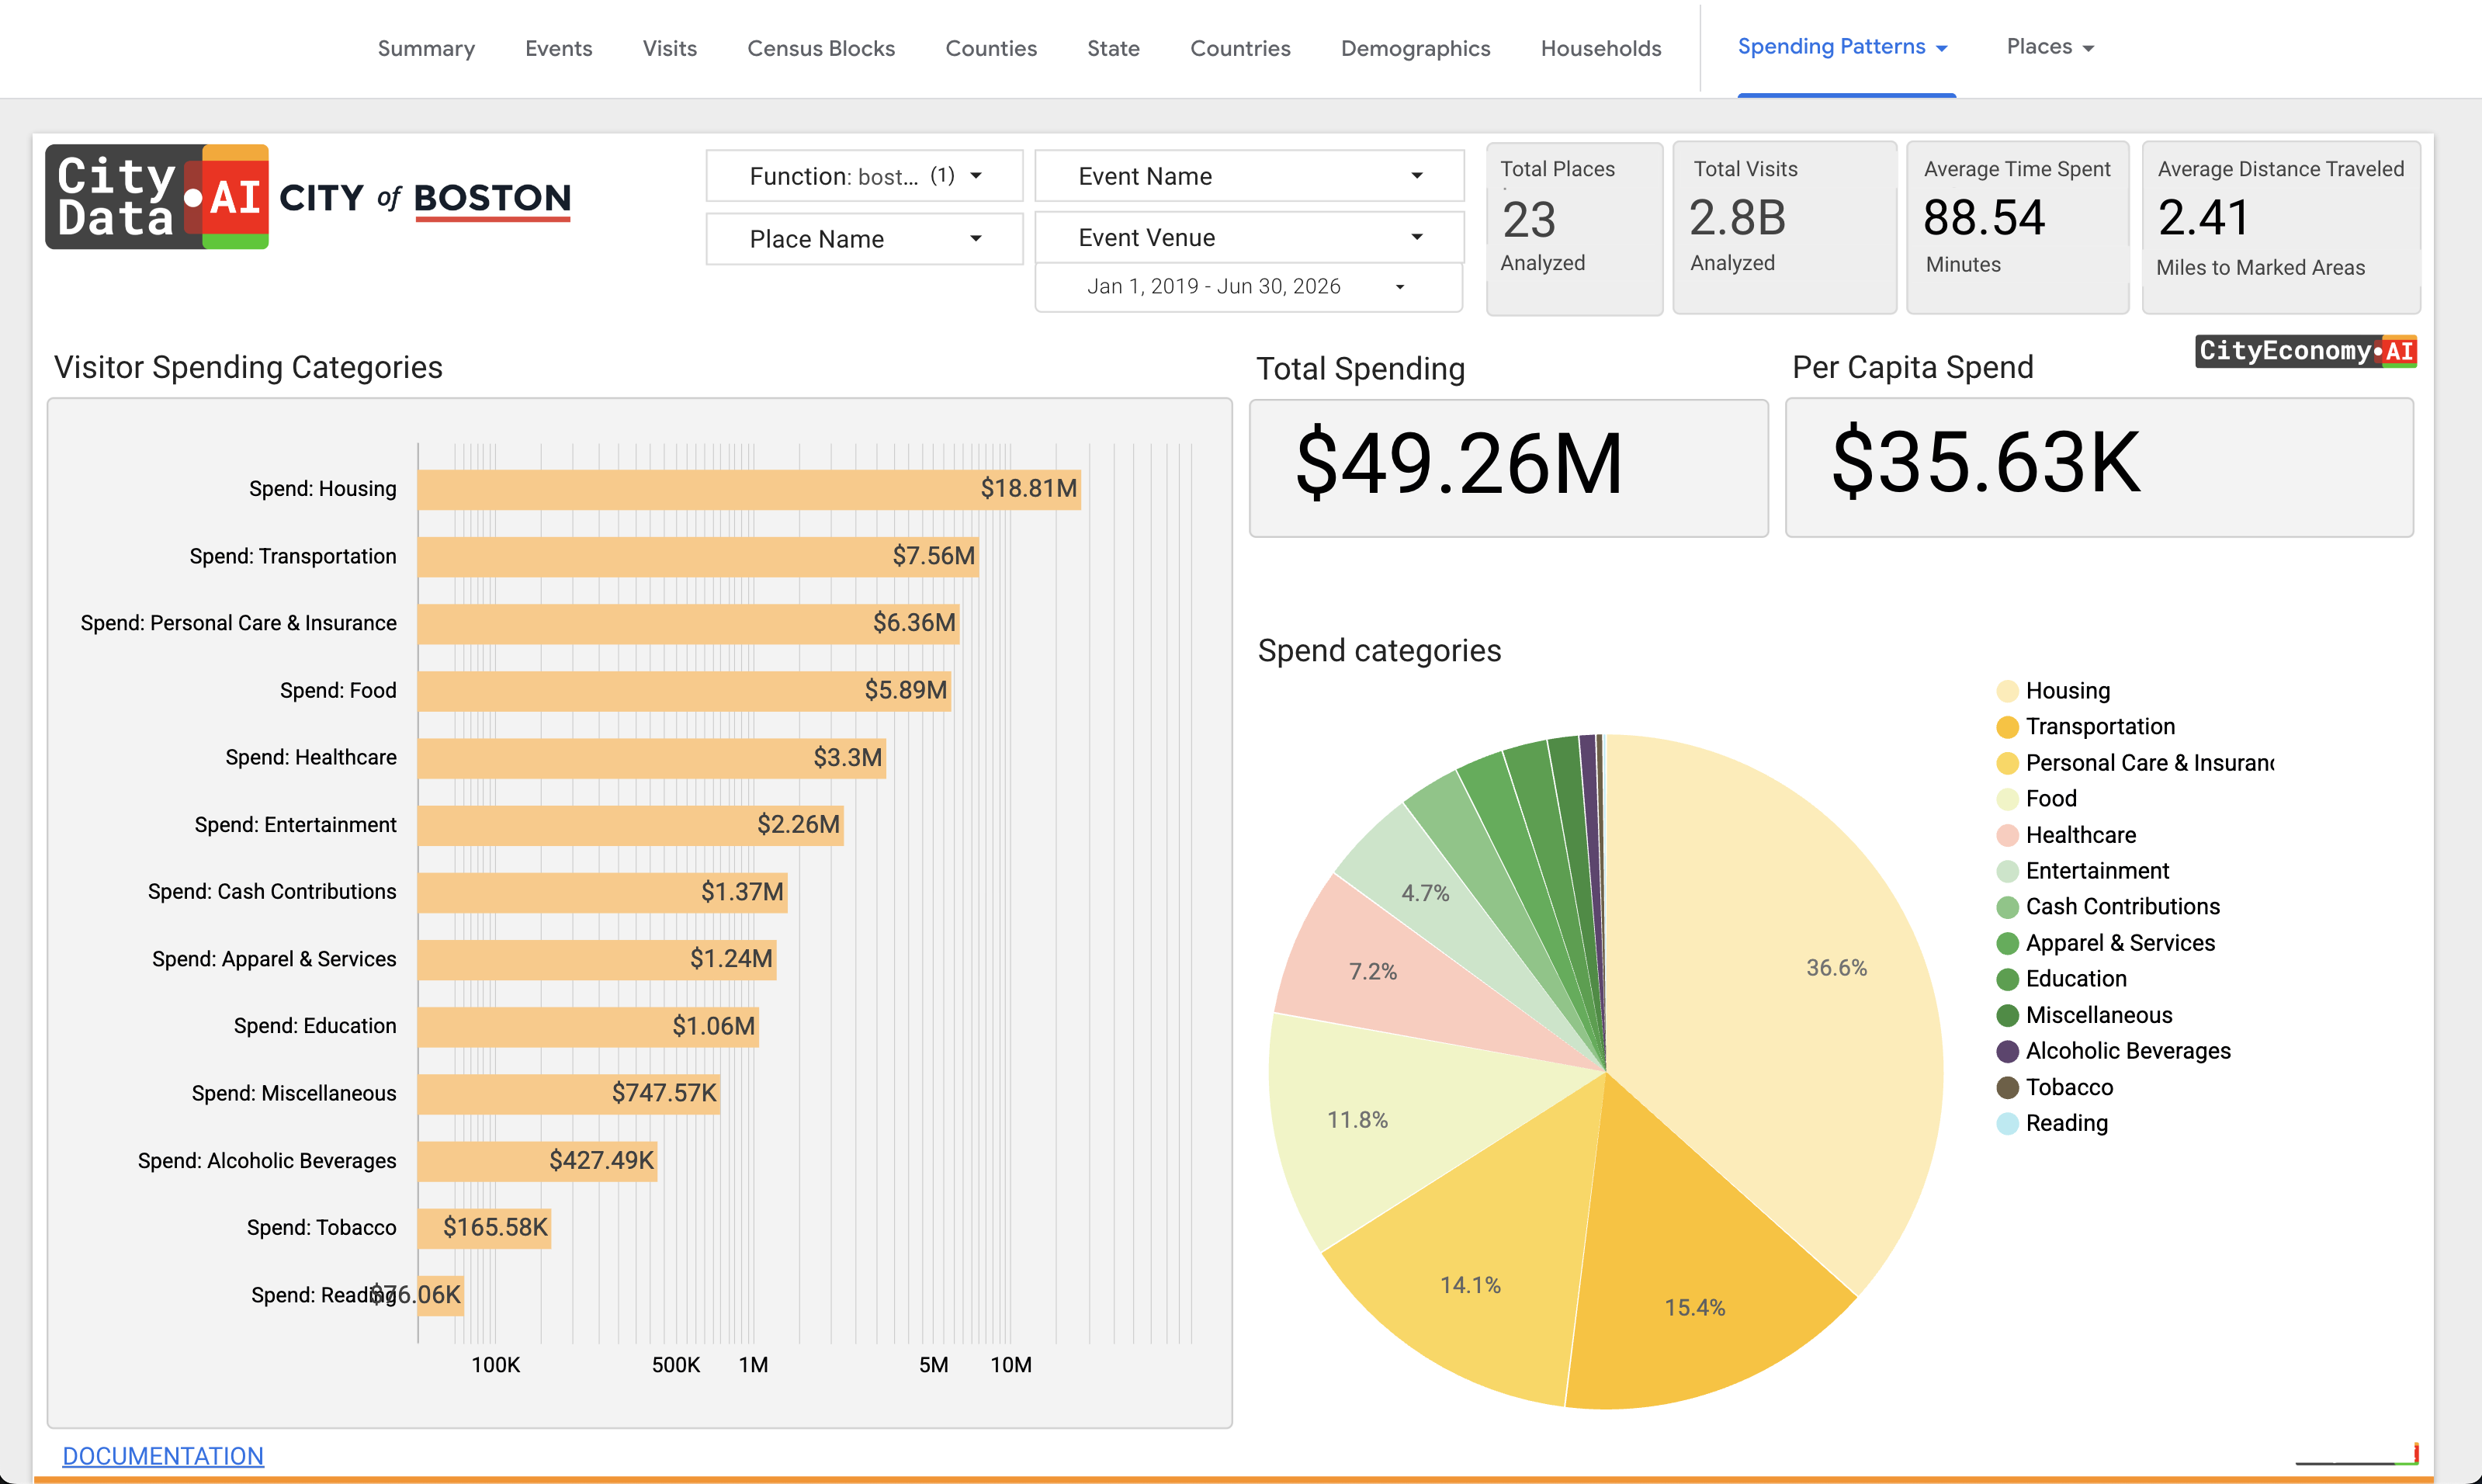
Visitor Spending Patterns
Spending patterns of park visitors at nearby businesses — evidence of the economic impact your parks generate.
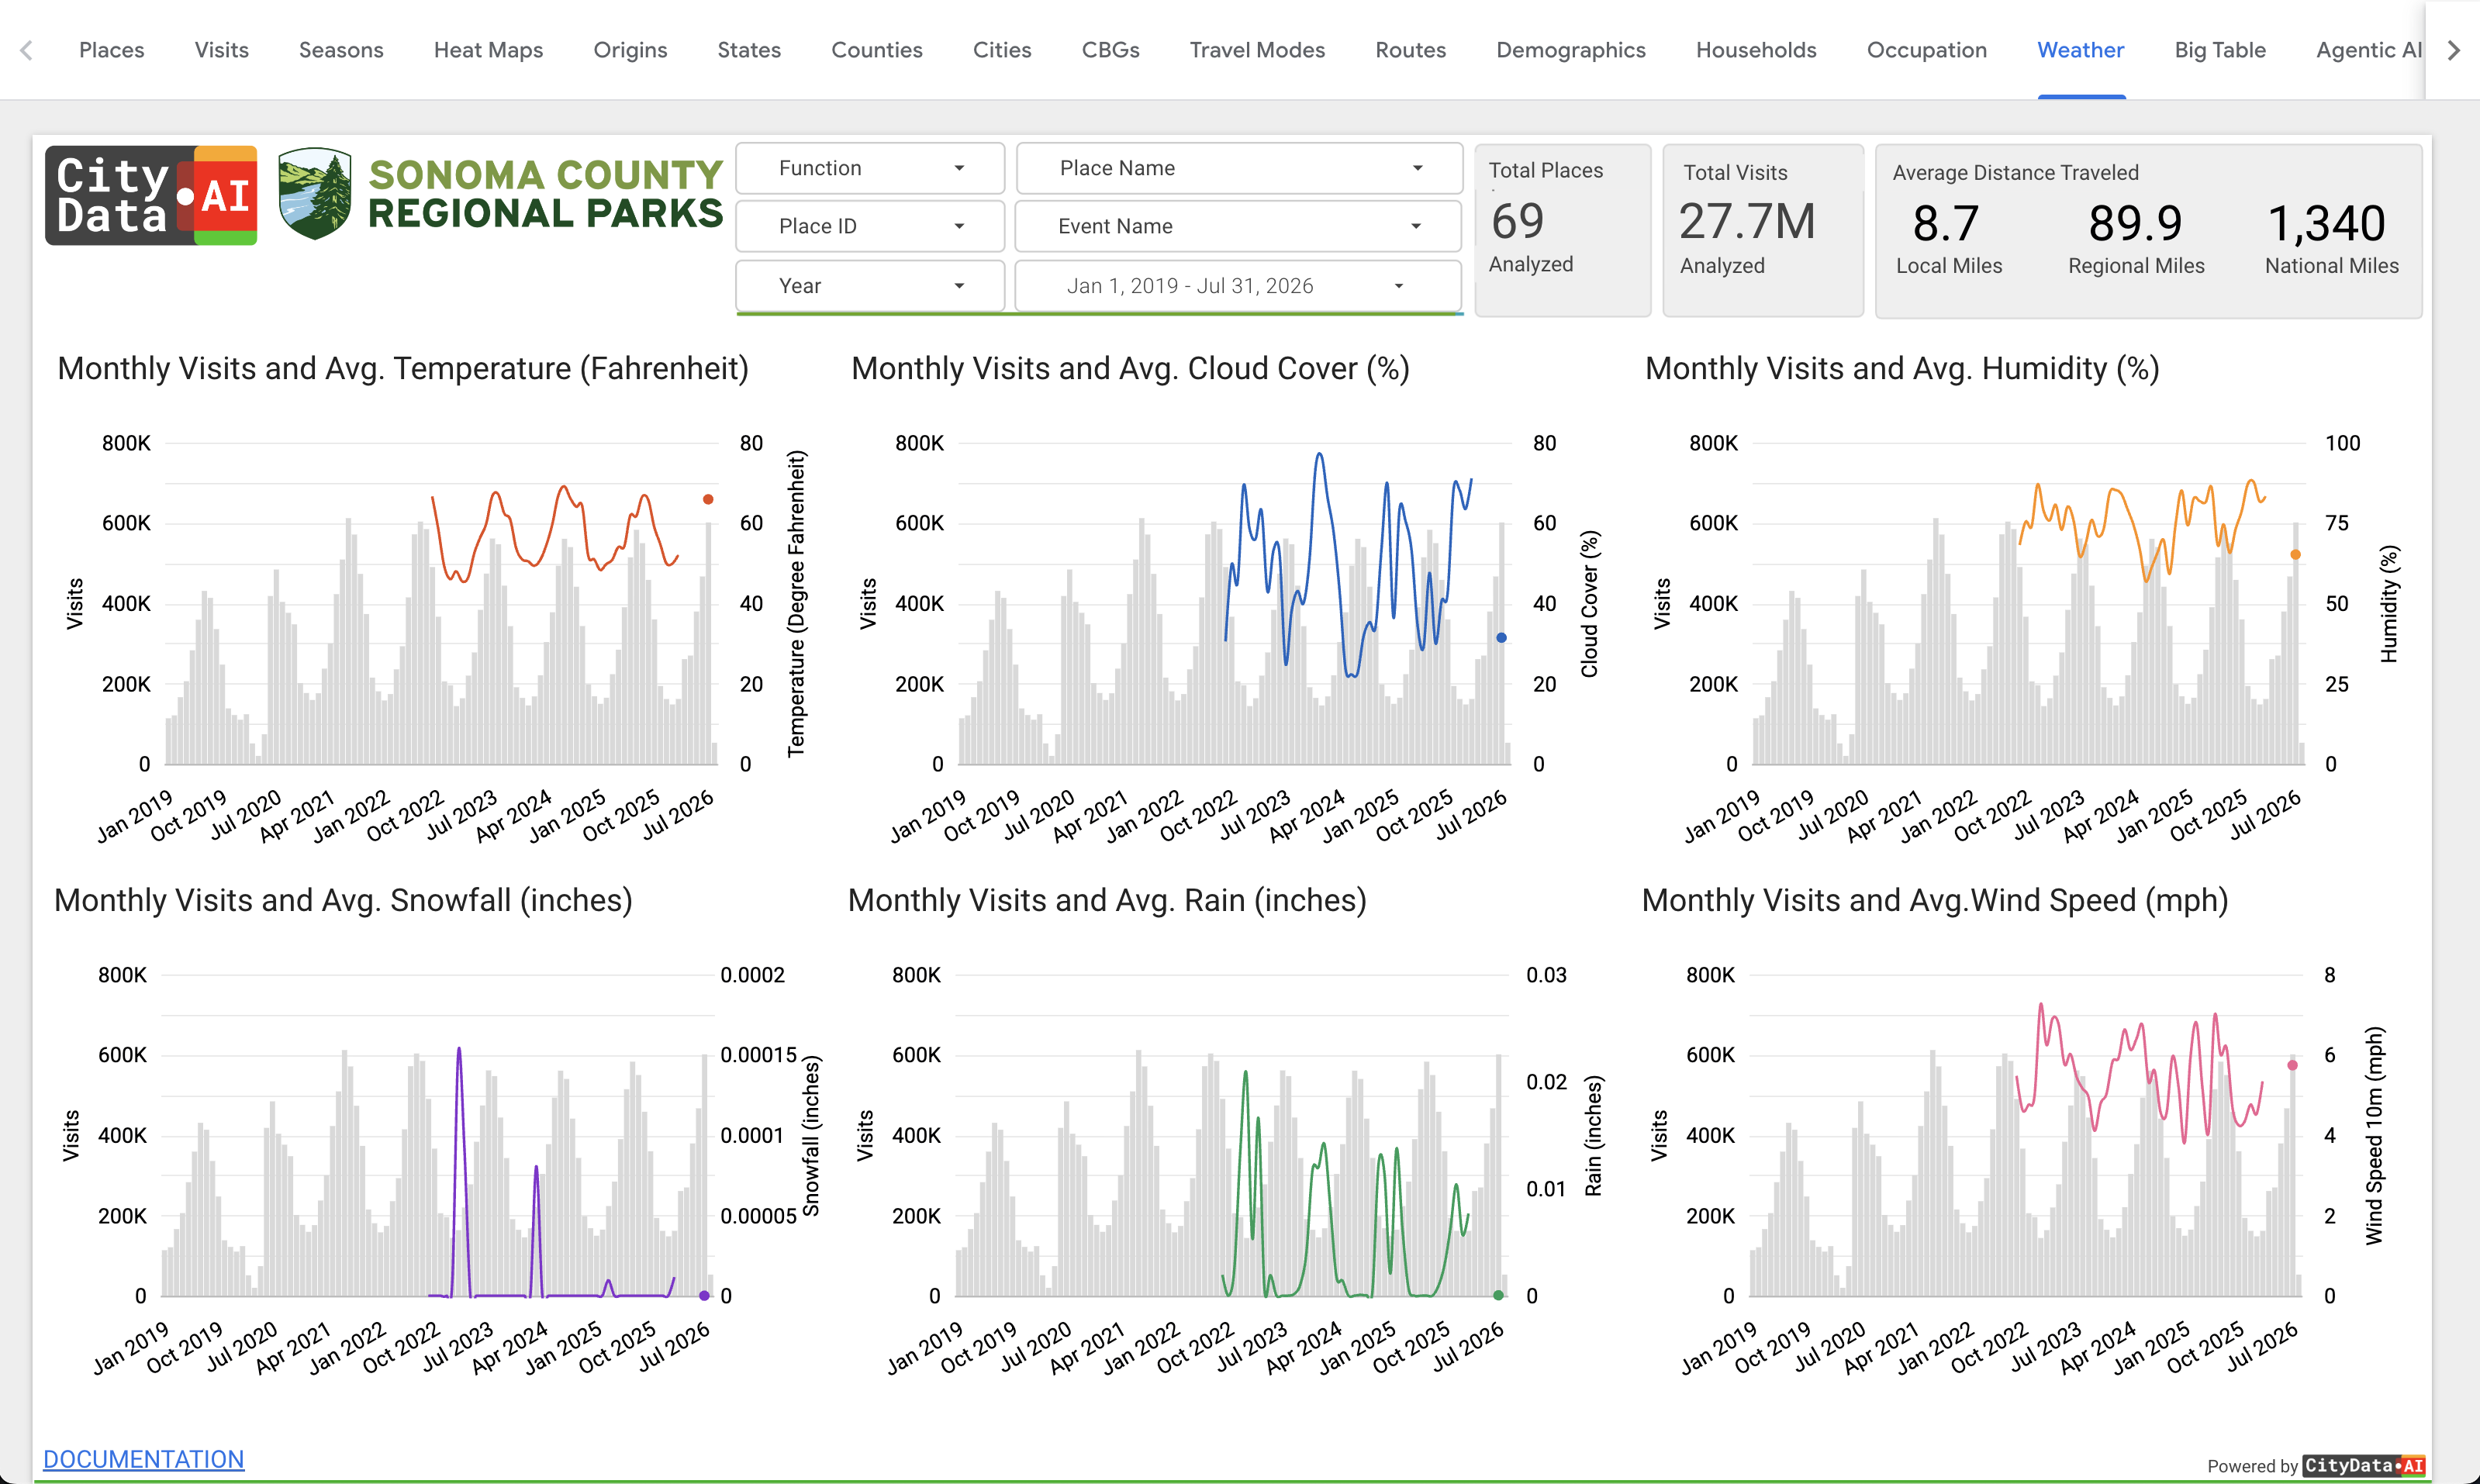
Weather Correlations
Visitation correlated with temperature, rain, snow, humidity, and season, so you can separate weather effects from real changes in demand.
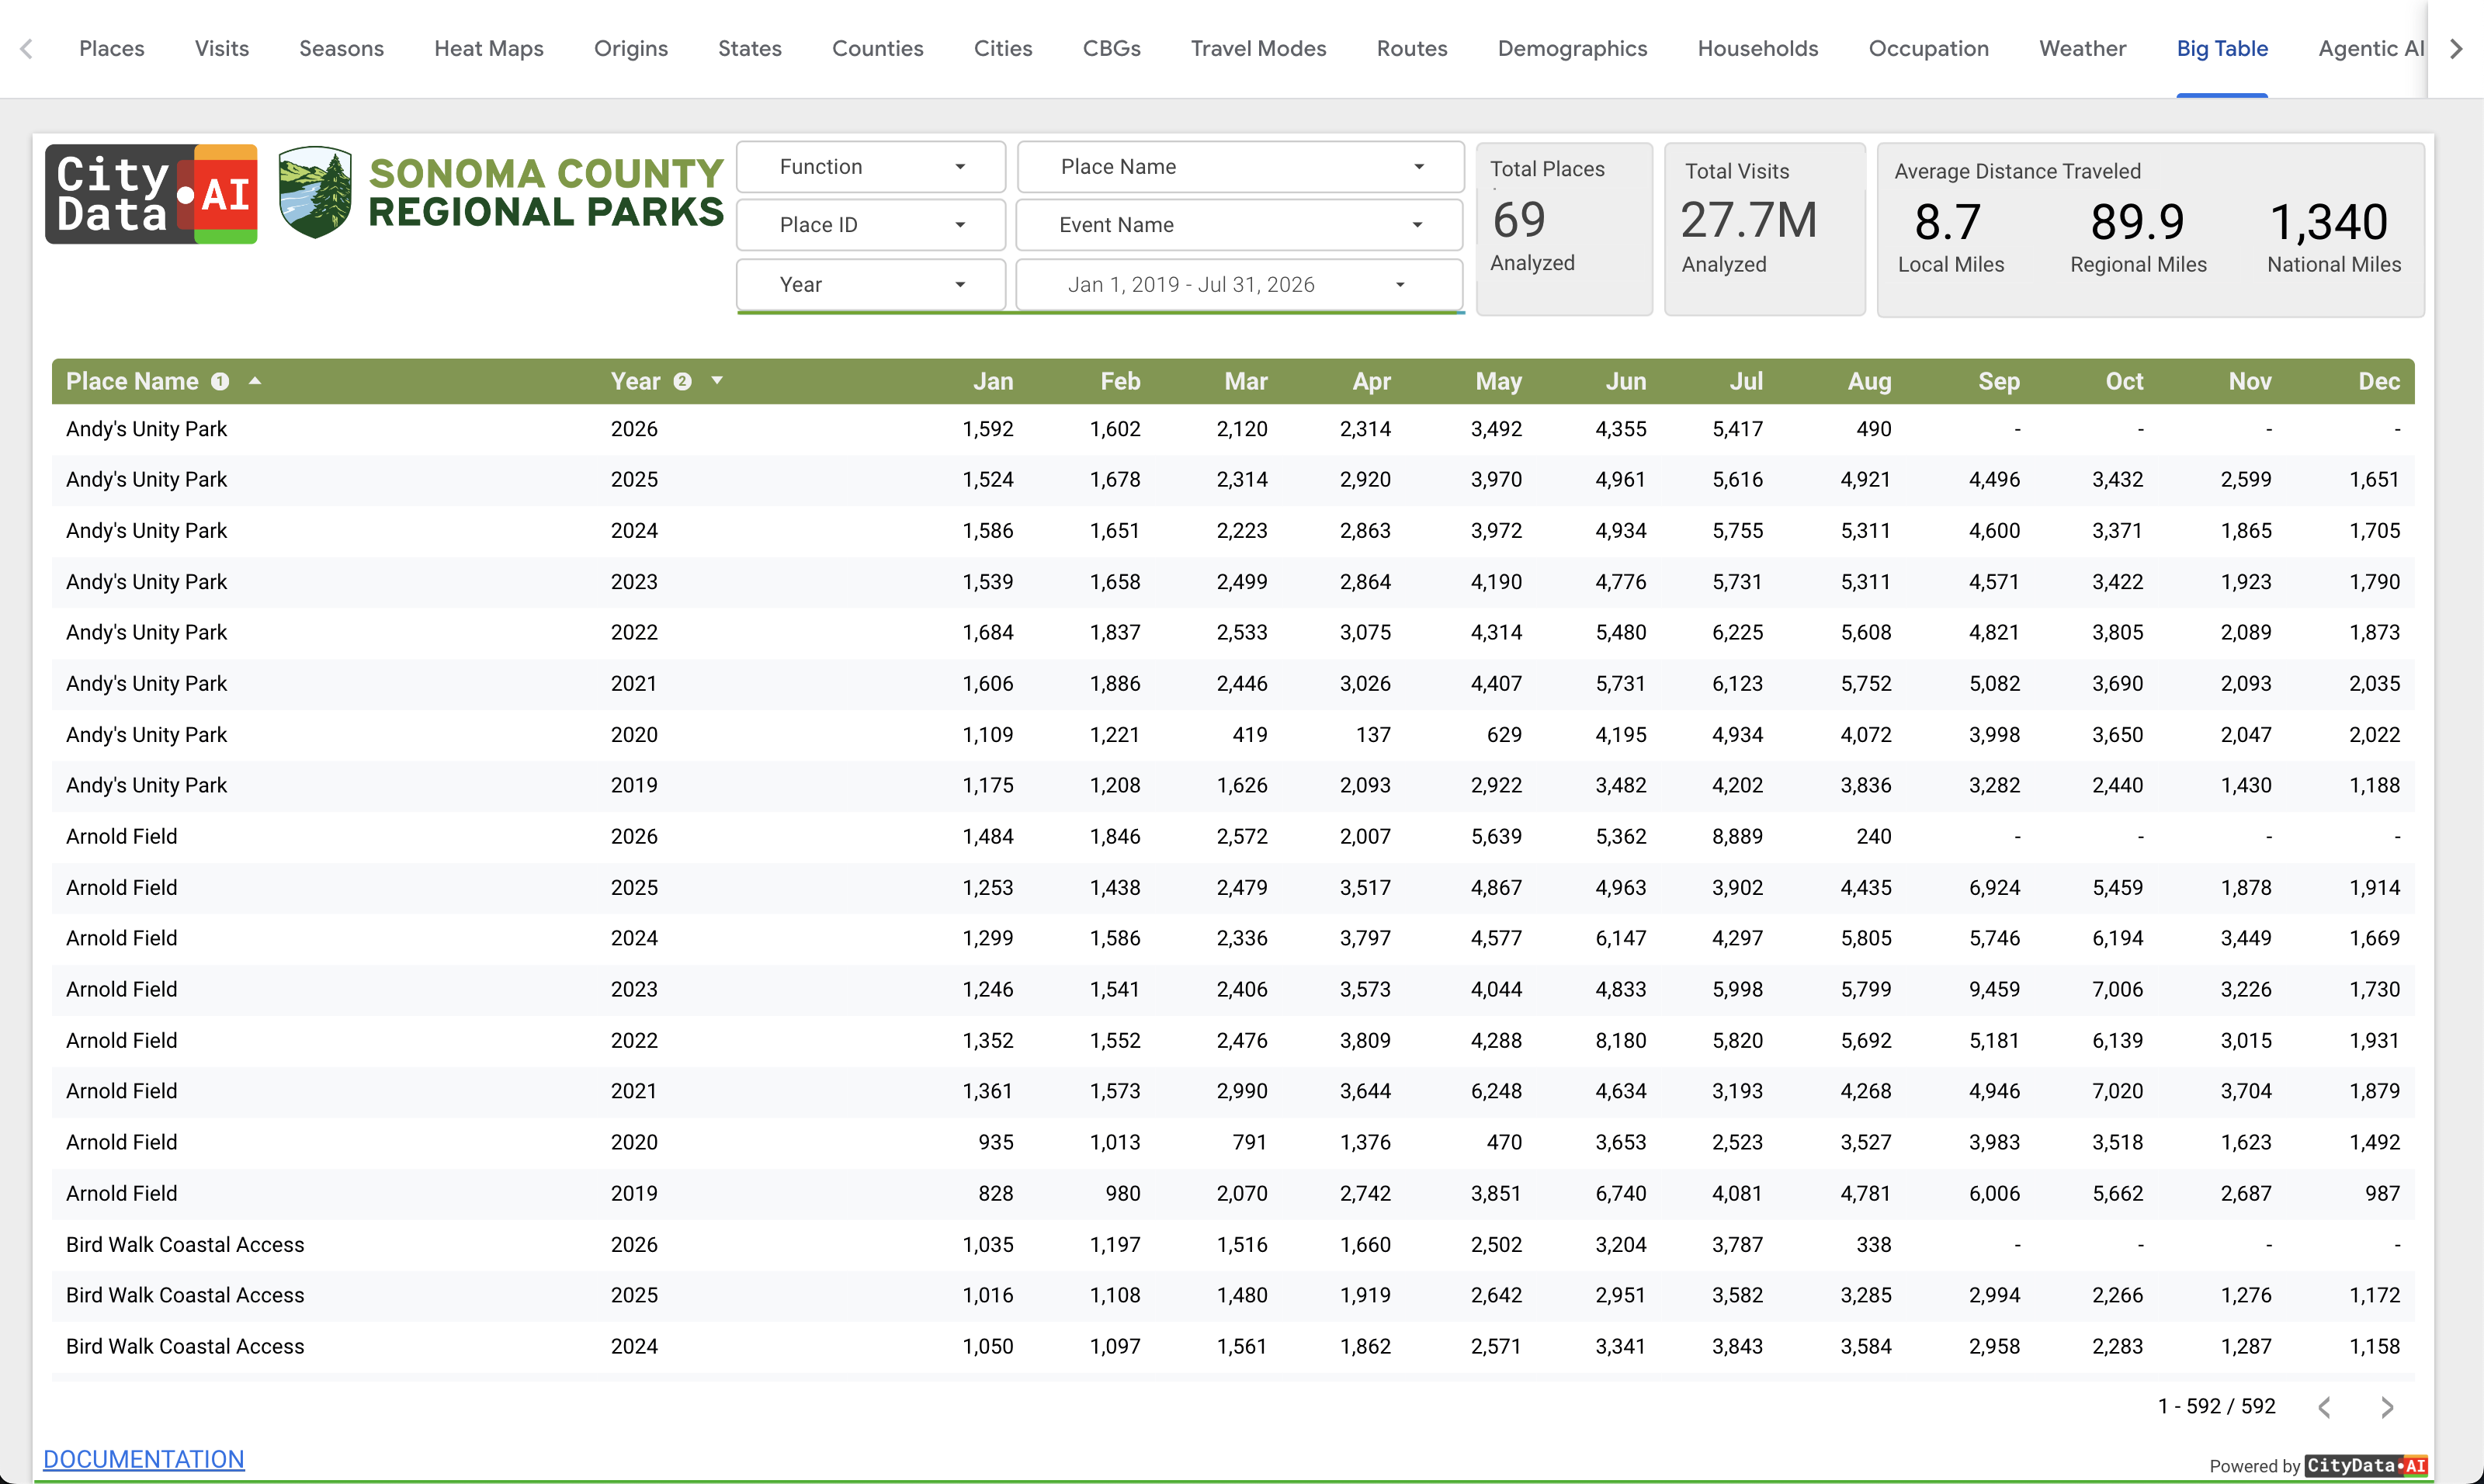
Big Table of Visits
Every visit in one sortable, filterable table — slice by place, date, and origin, then export exactly what you need. Option to connect directly to Google BigQuery and run SQL queries.
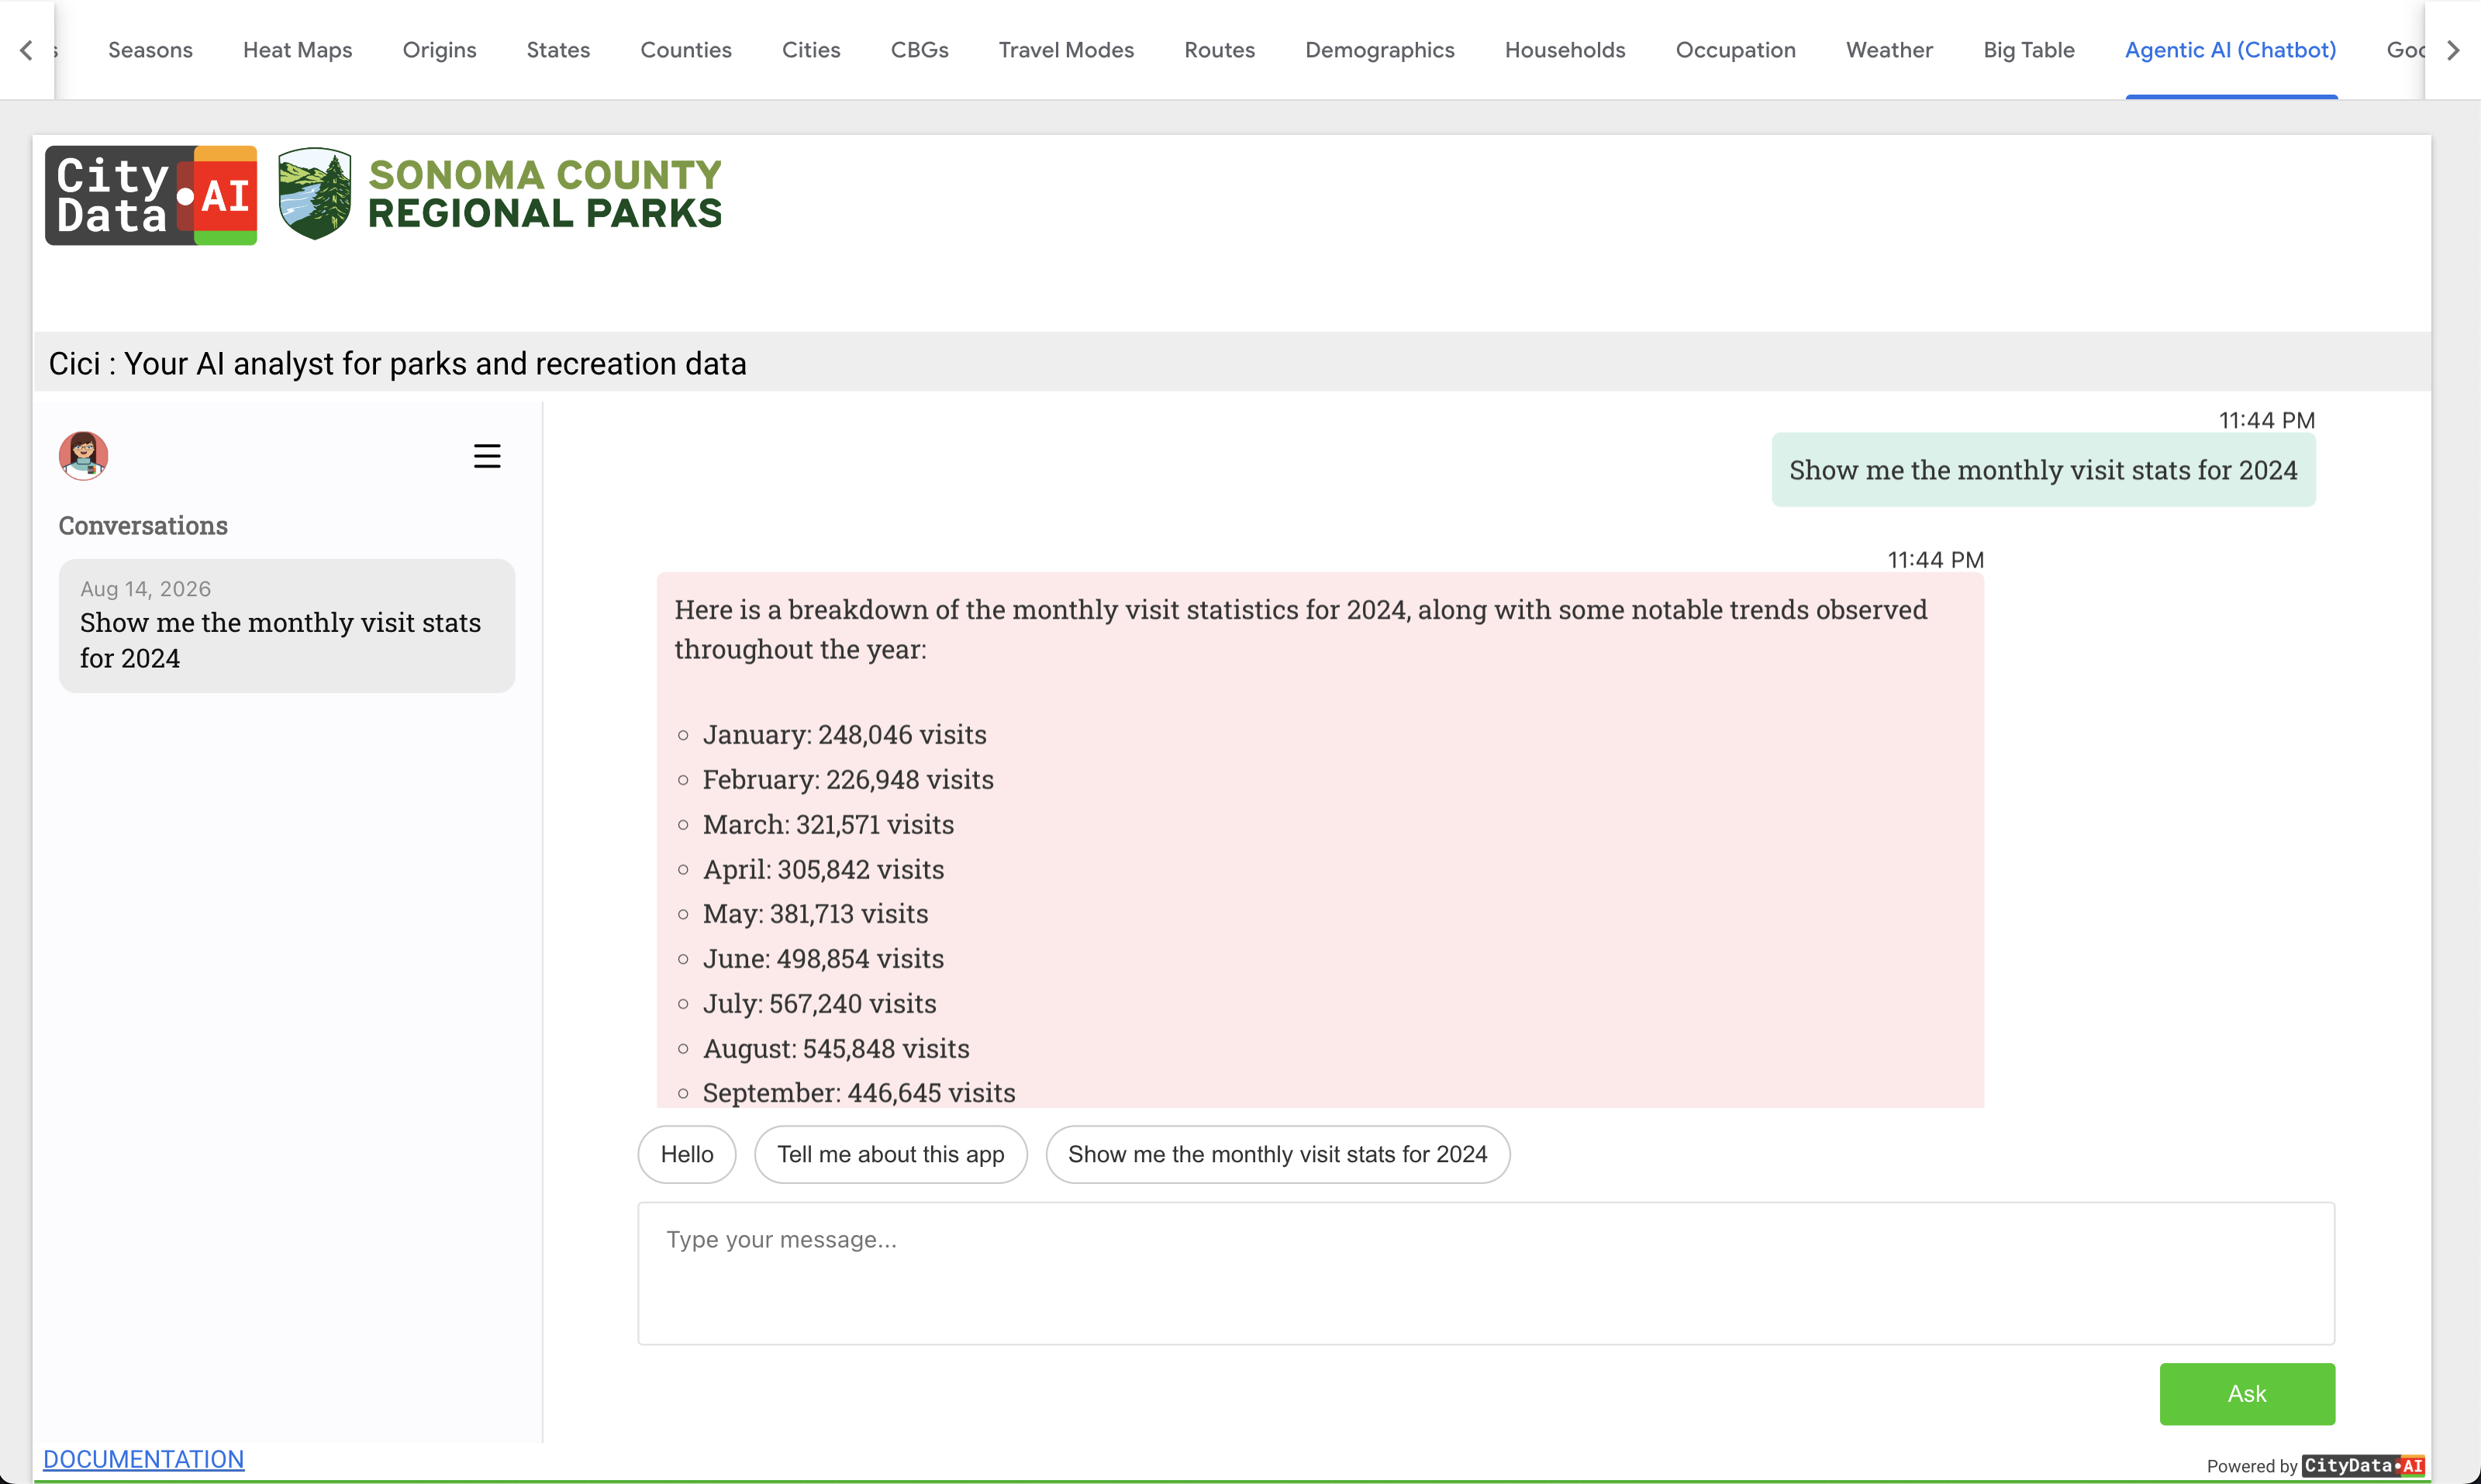
Agentic AI Chatbot
Ask questions in plain English — “which trail grew the most this summer?” — and get answers straight from your own visitation data.
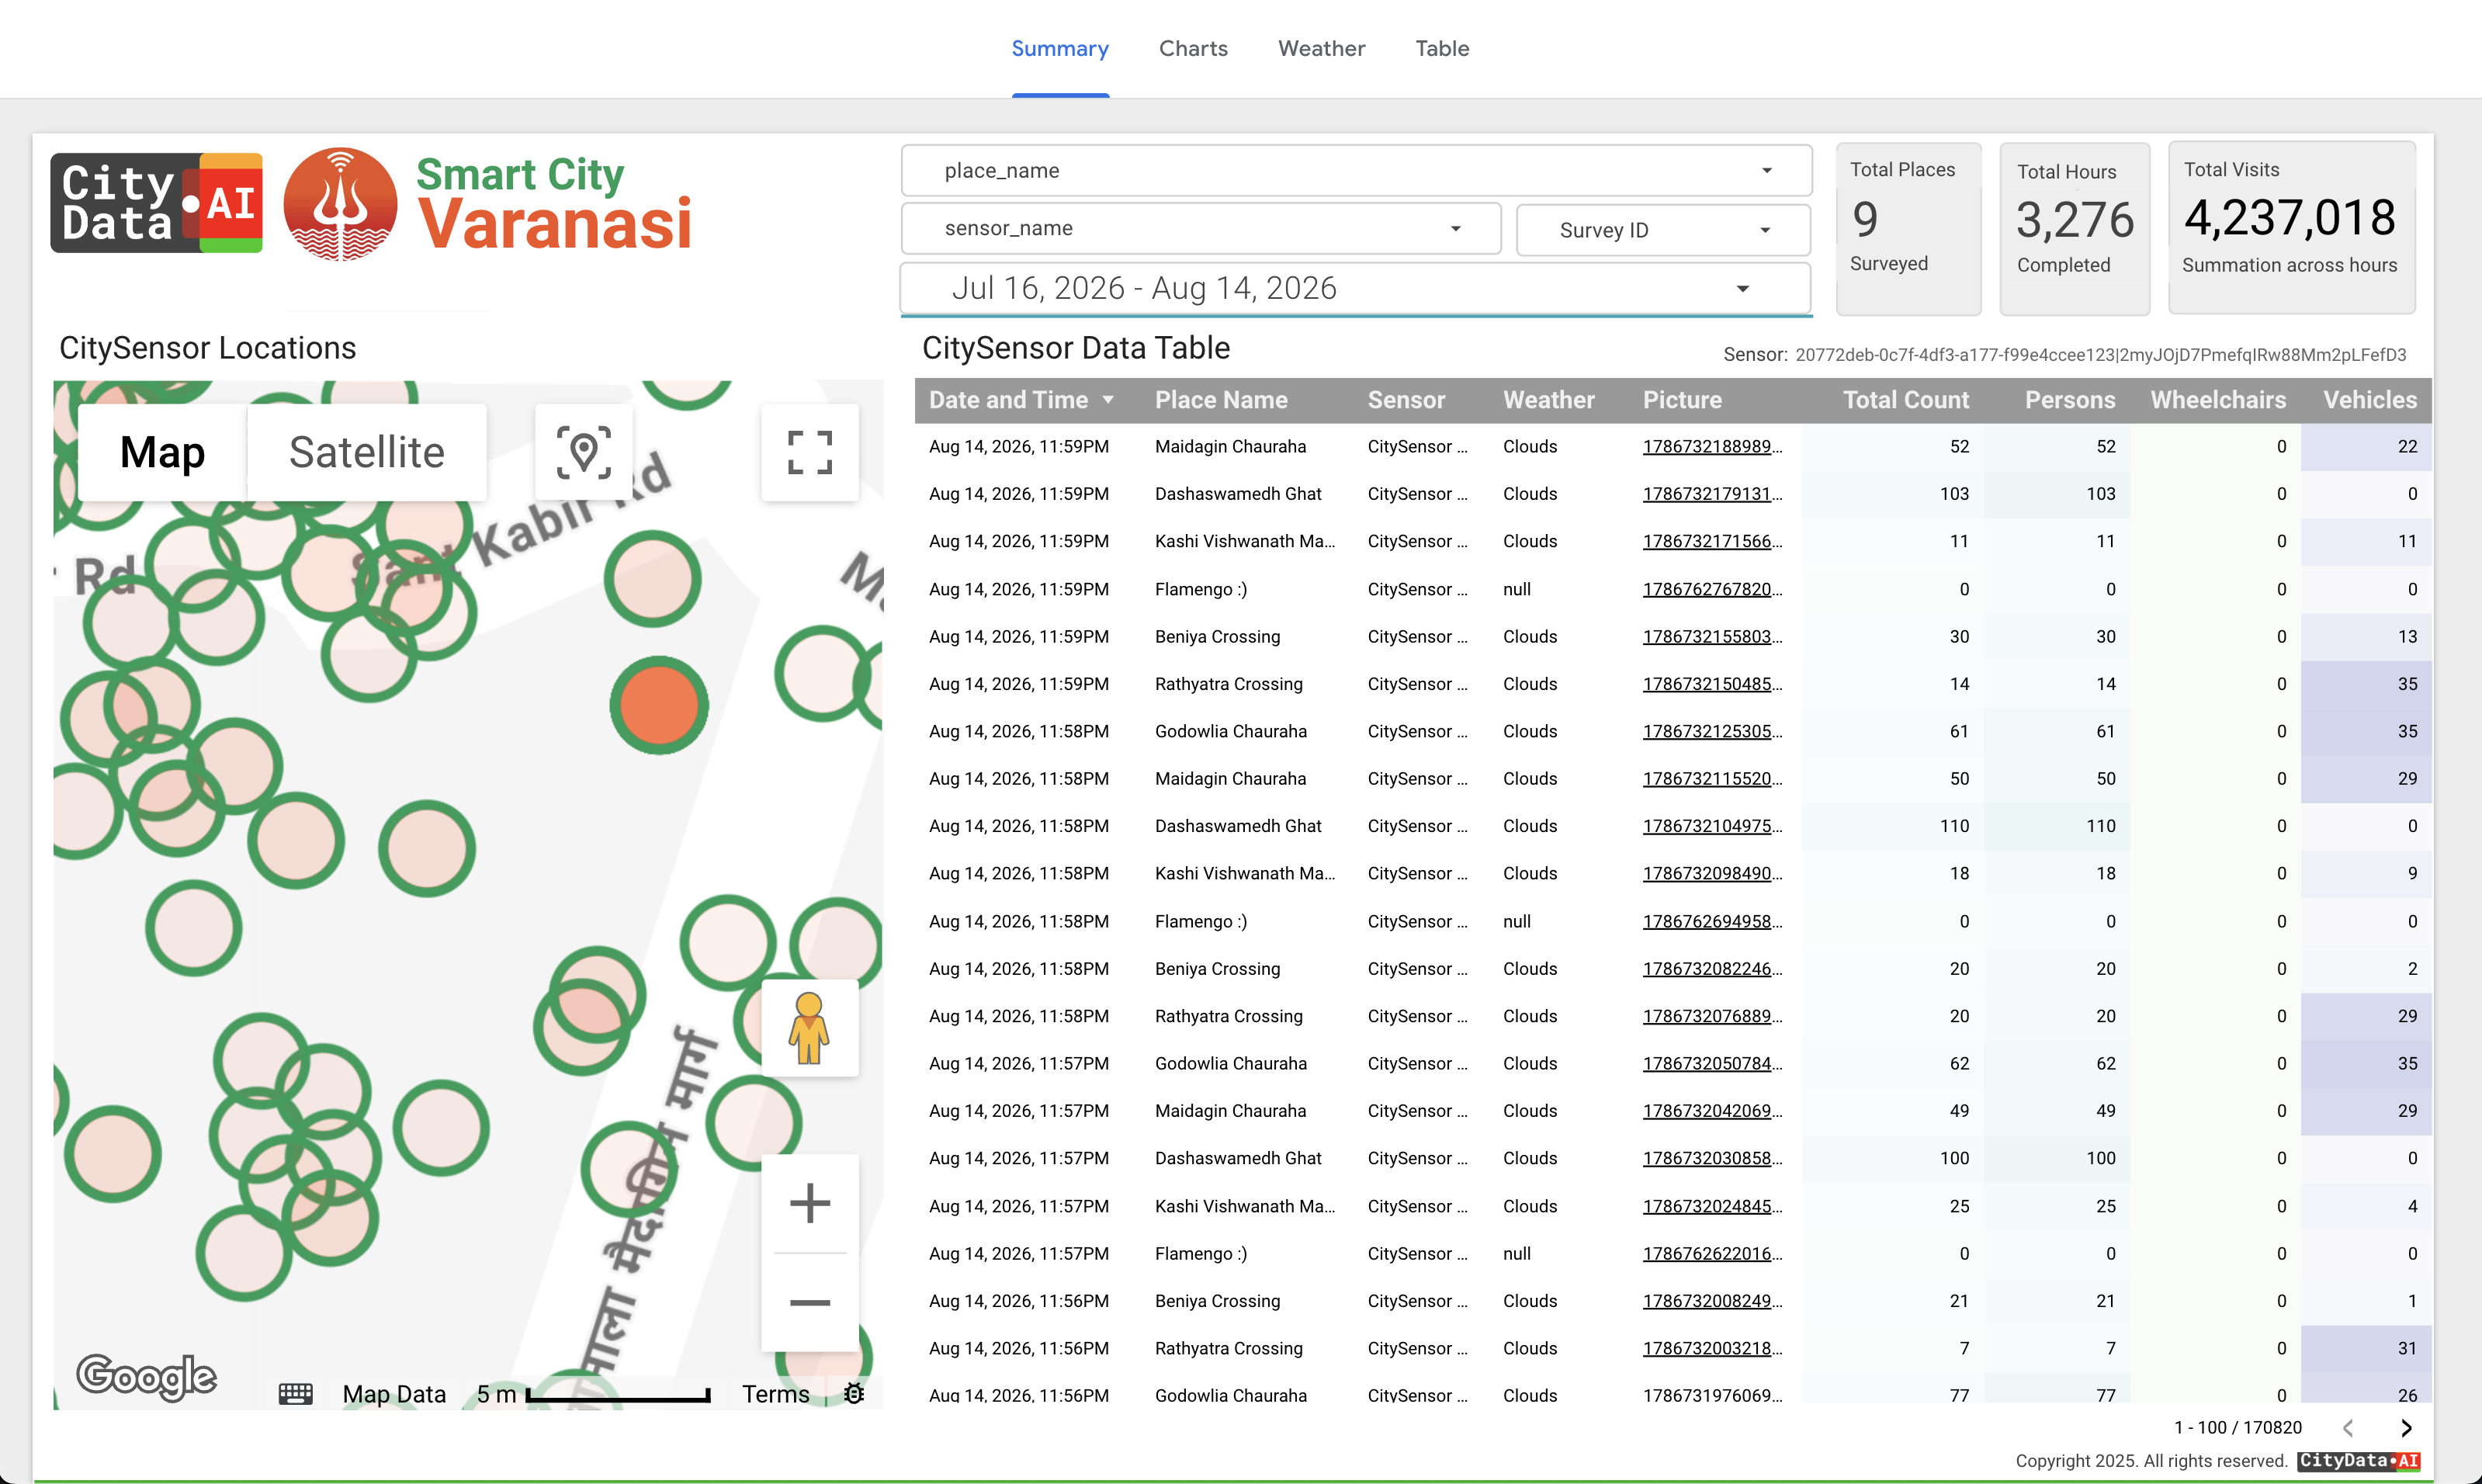
Hardware Sensor Integration
Blend counts from legacy sensors, trail counters, traffic counters, or install our new solar-powered optical sensors and receive real-time counts directly into your visitation dashboard.
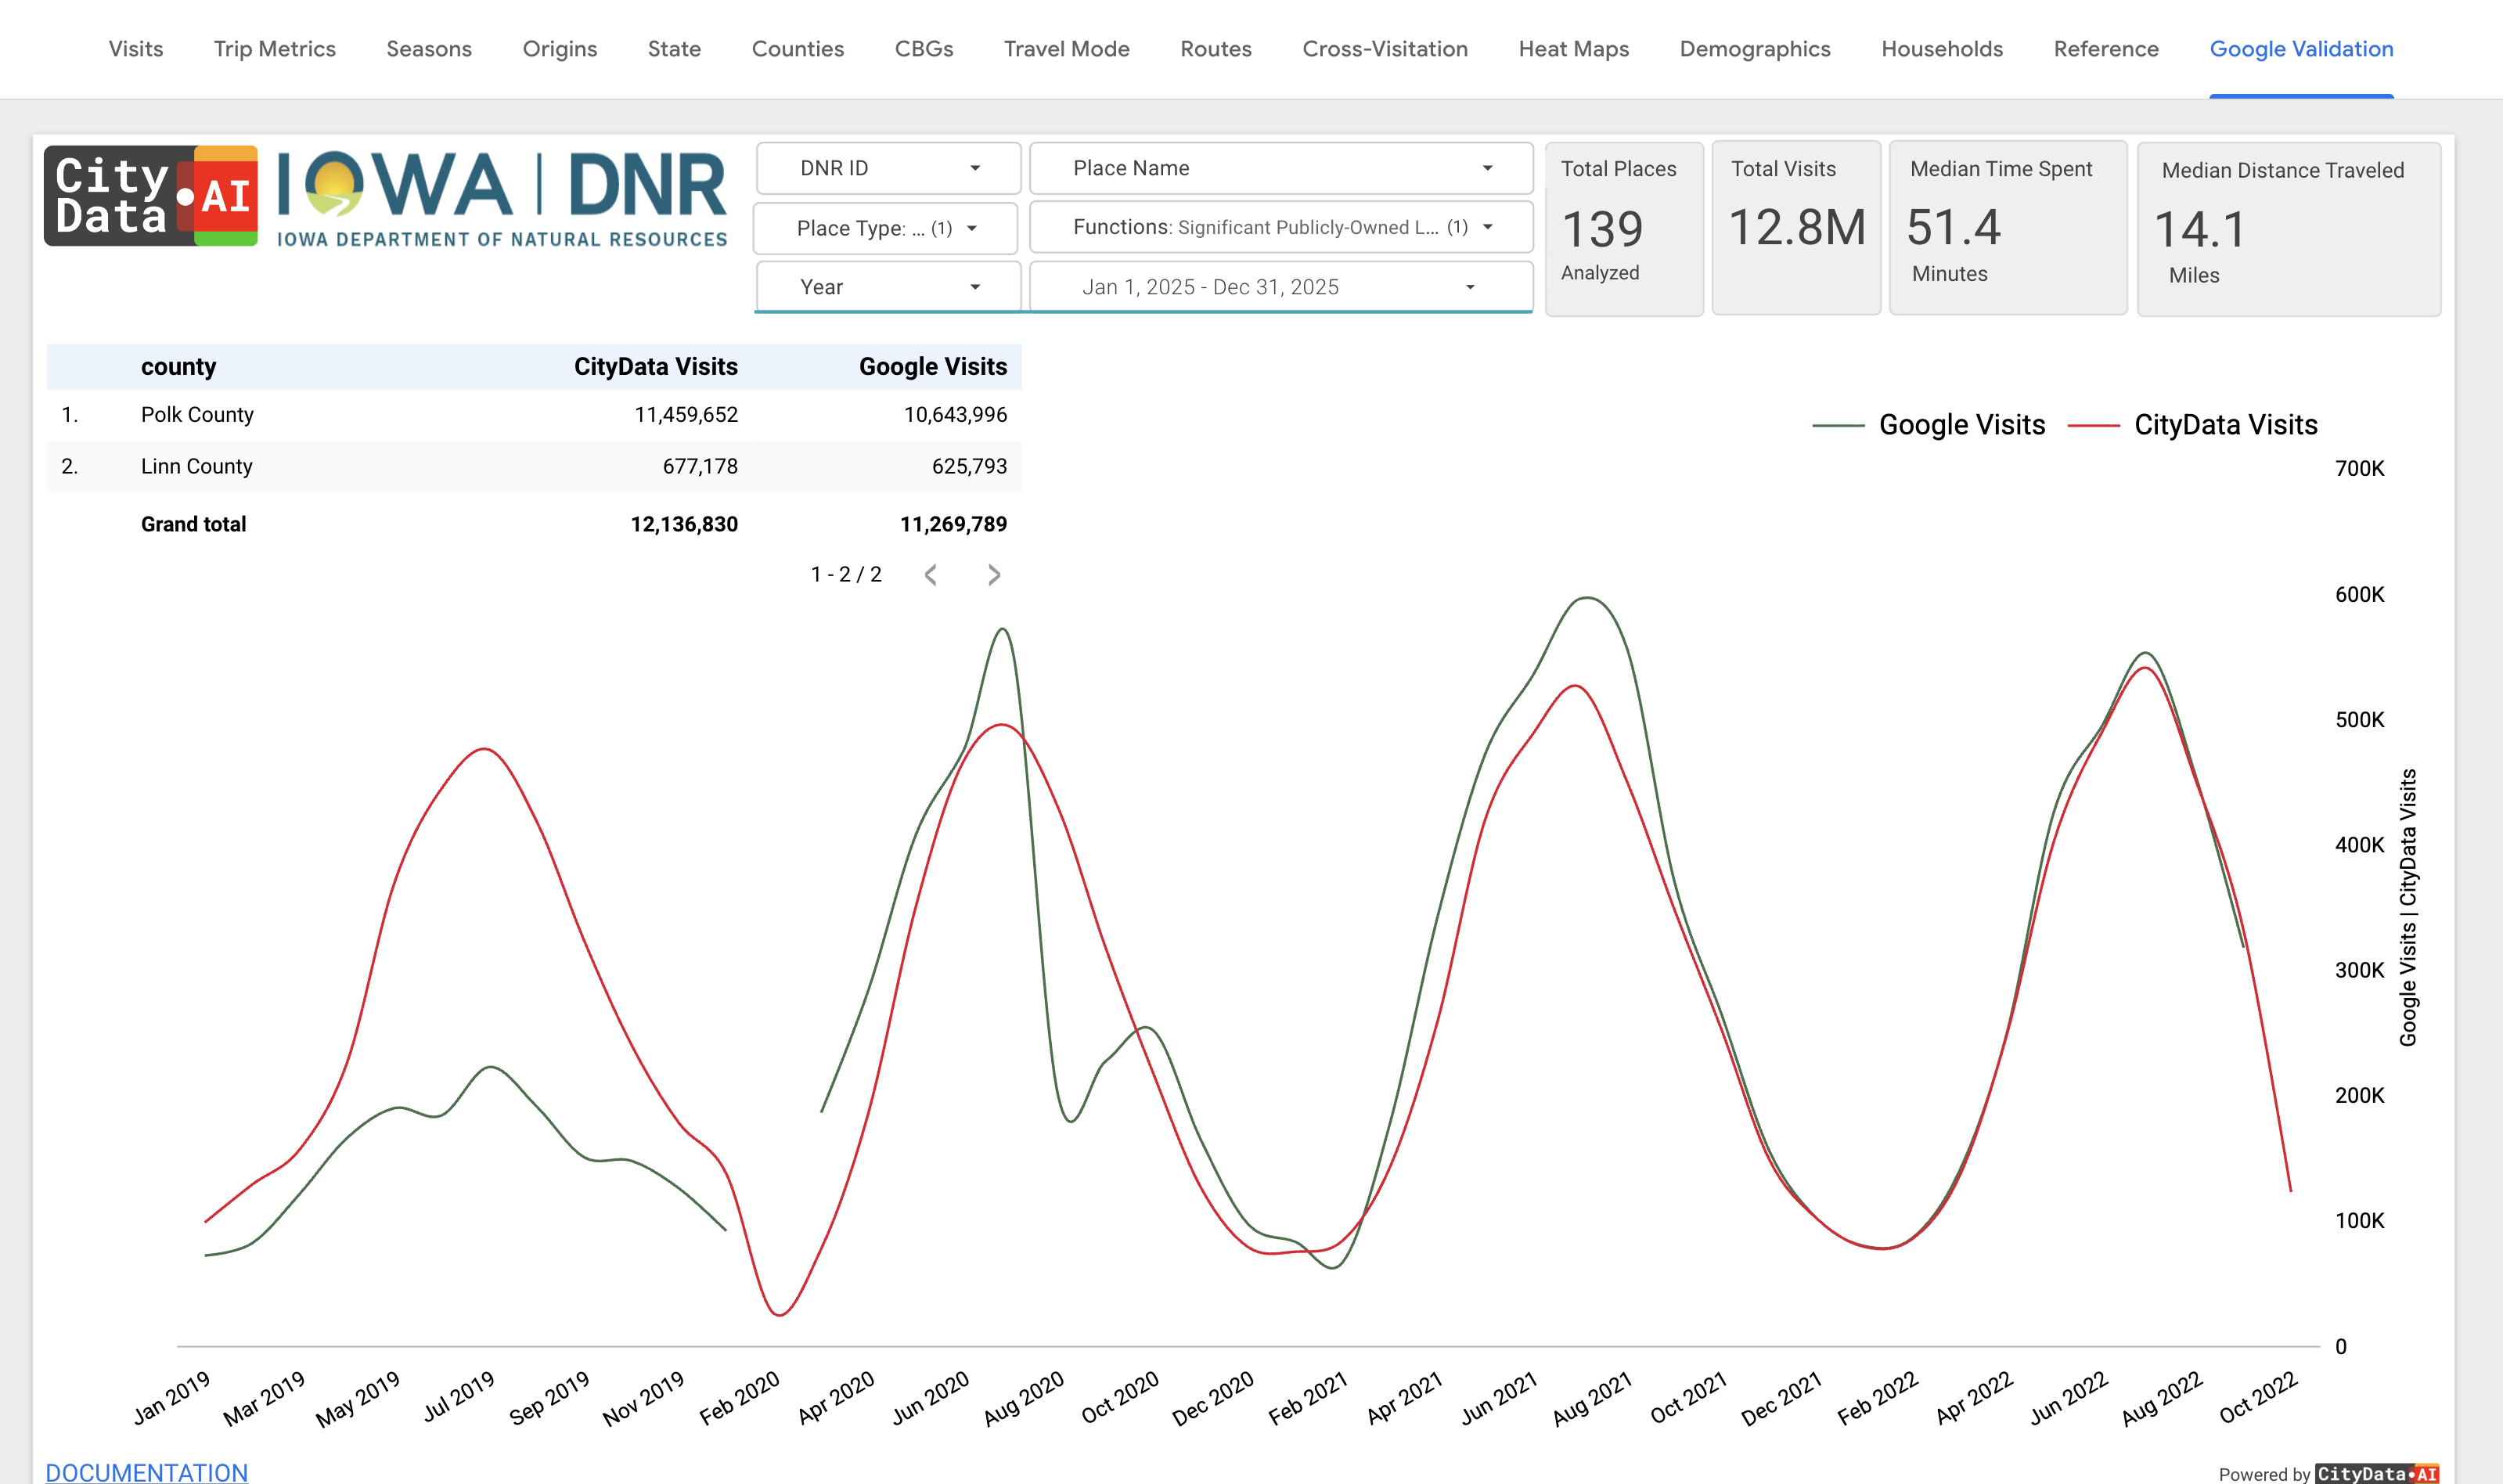
Ground Truth Validation
Every number is validated against measured reality — sensor counts, registration data, reservations, field surveys — so you can defend the data with confidence.
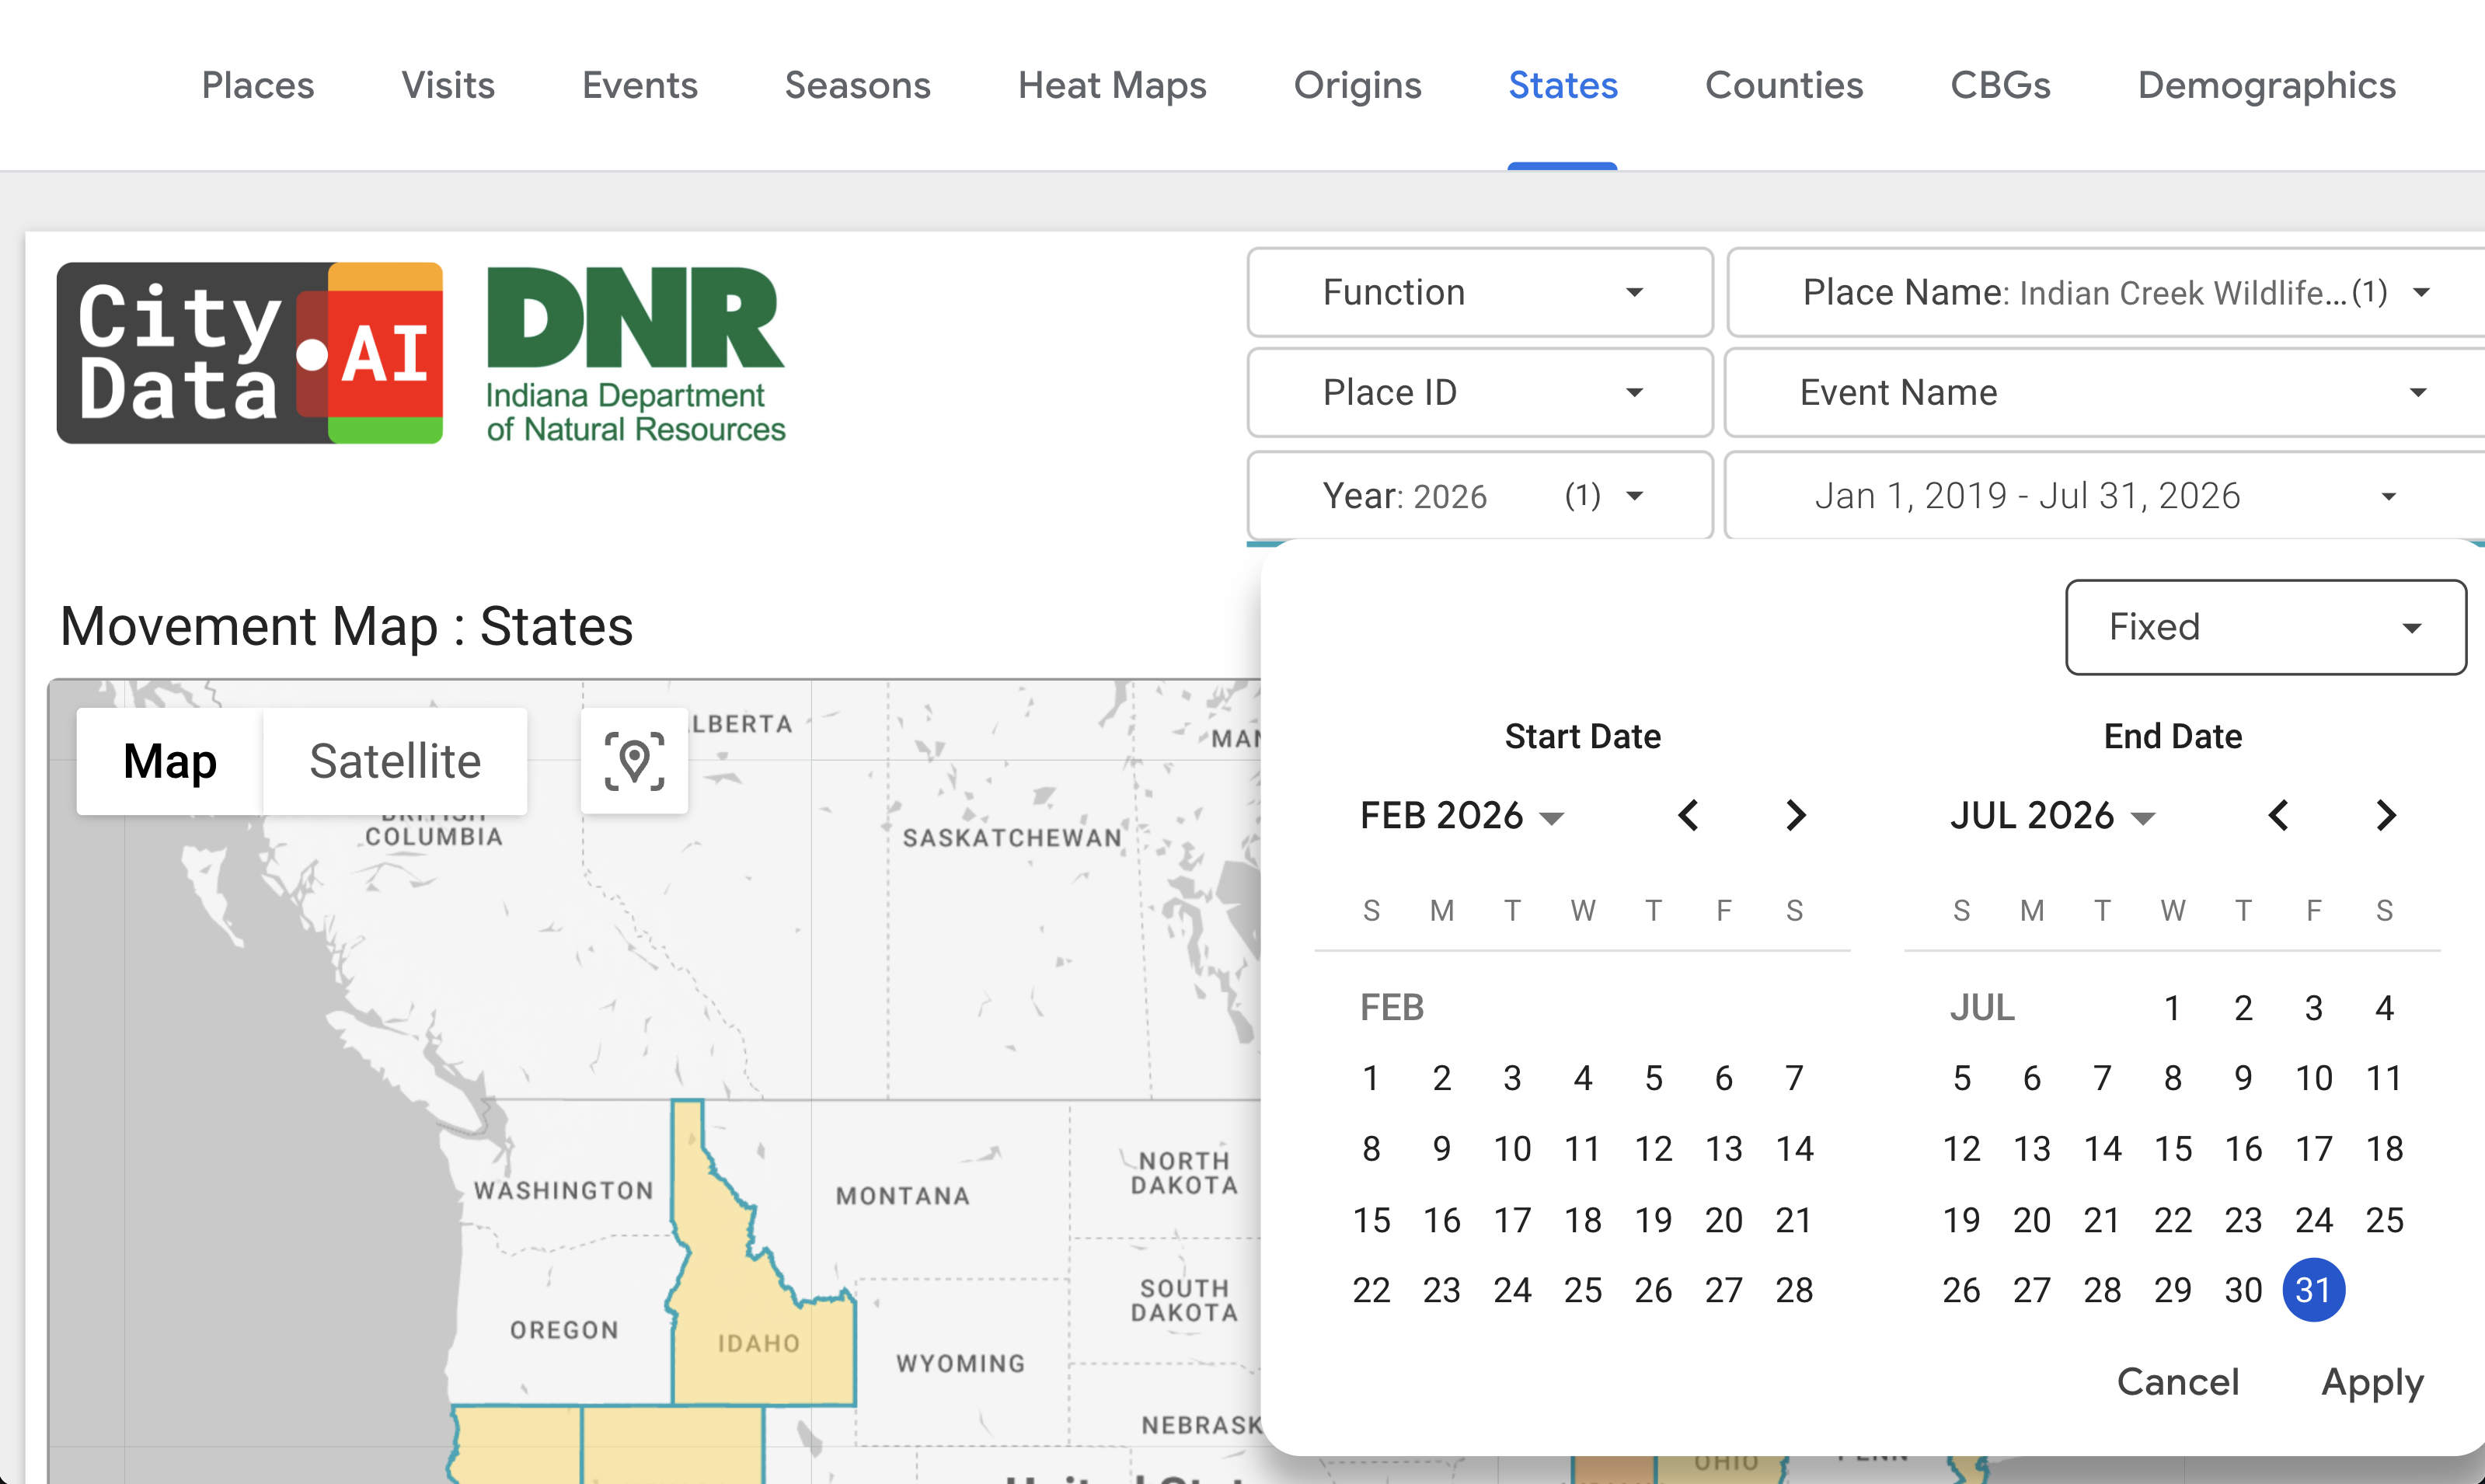
Dashboard-wide Filters
Slice everything by place type, park name, city, year, or date range with filters that apply across every page of the dashboard at once.
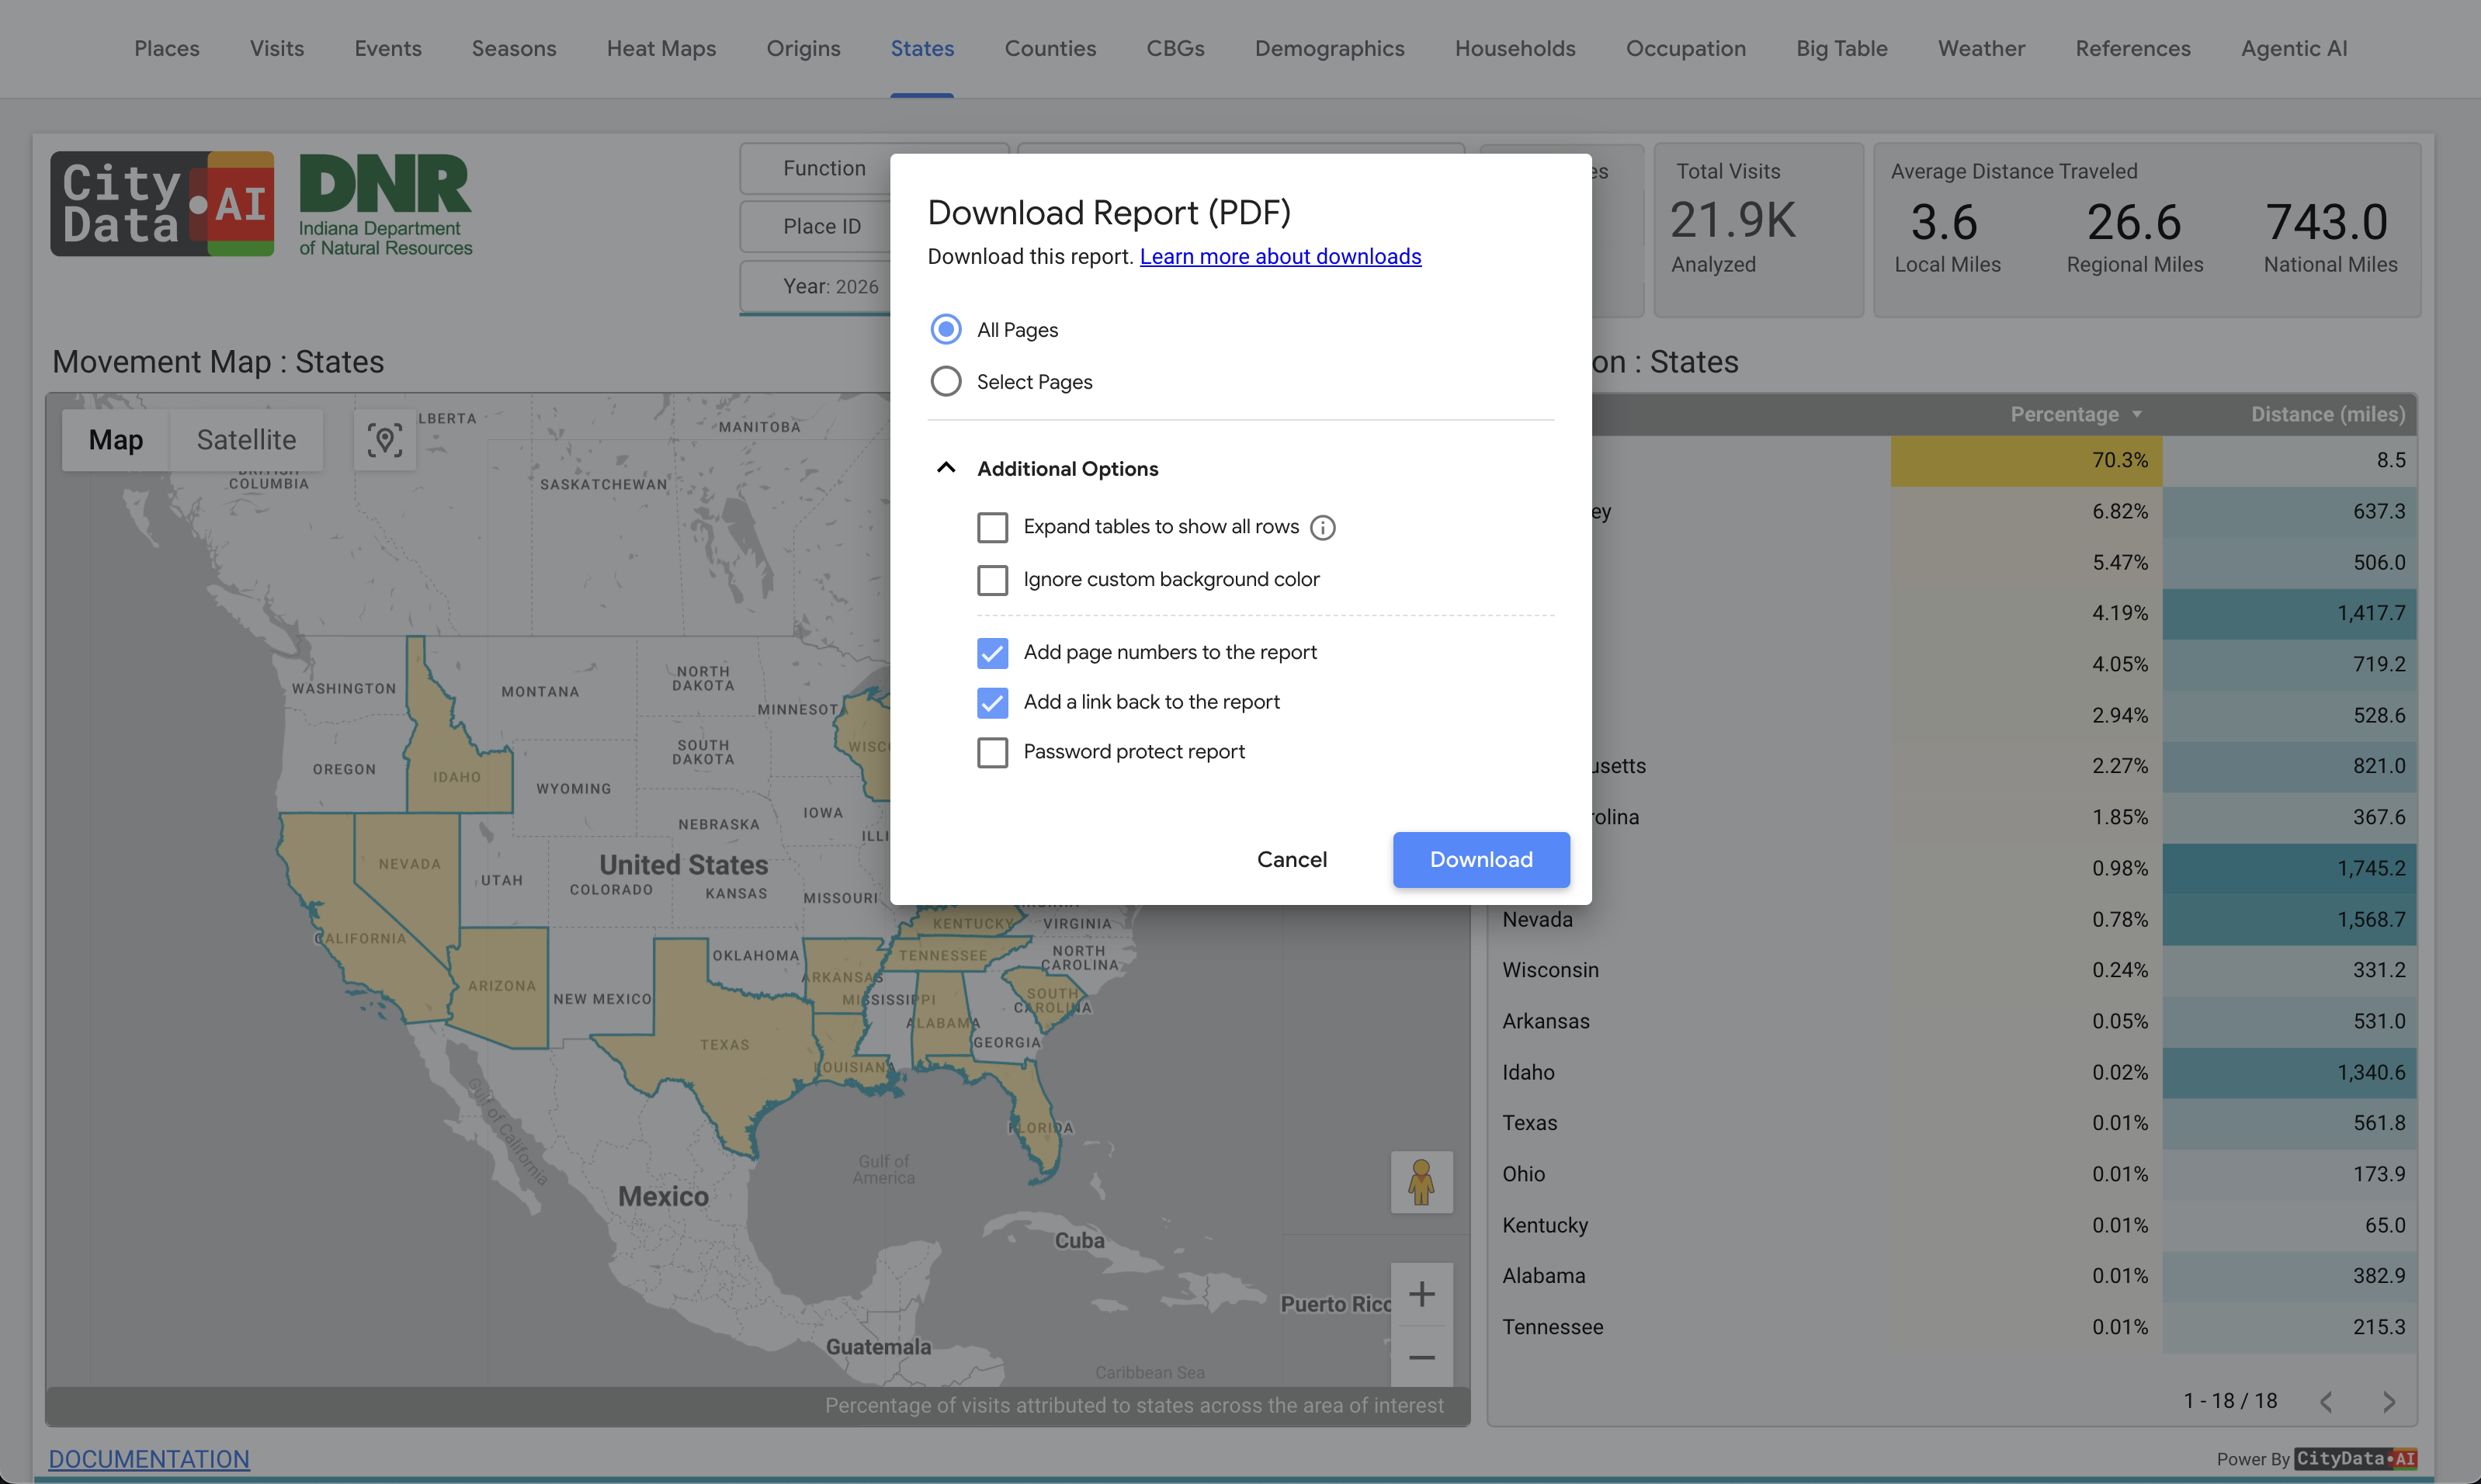
Exports, Reports & Data Delivery
Download the data behind every chart, share reports with council and grant reviewers, and receive scheduled data deliveries to your own cloud.

Consumer Spending Patterns
See how your park and trail visitors actually spend across 600+ categories — from food and dining to retail, recreation, and travel. Spending patterns are available at the Census Block Group (CBG) level for every county across the United States, built from an actual panel of anonymized transaction data combined with a sophisticated model that blends ACS 2024, BLS CE 2024 PUMD, CityData Places (POI), and crowdsourced mobility data — defensible economic-impact evidence at neighborhood resolution.
Everything included
The full CityParks feature list, standard with every subscription.
- Privacy-compliant, anonymized, and aggregated data
- Full dashboard that works on desktop and mobile
- Unlimited users within your agency at no extra cost
- Dashboard link customized with your agency name
- Your agency's logo prominently displayed on each page
- Dashboard charts and maps customized to your agency
- Internal version for your agency, external version for the public
- Unlimited downloadable reports and Excel or CSV data files
- Direct access to Google cloud data warehouse for SQL queries
- Dedicated Customer Success Manager and Account Manager
Works better together
CityParks is part of the Parks, Trails, & Natural Resources solution. Pair it with these products:
CitySensor
Count people, vehicles, and animals with precision using our ruggedized outdoor solar-powered 4G IoT privacy-compliant optical sensors.
Learn more →CitySurvey
Capture the ground truth data in real time by setting up surveying apps on any mobile device in parks, trails, events, downtowns, & intersections.
Learn more →CityBase
Reserve, register, and book recreation programs, events, passes, campsites, picnic shelters, cabins, golf tee times, marina boat slips, with real-time availability and contactless checkout.
Learn more →CityOps
Optimize operations, manage tasks, fleets, assets, and field workforce with advanced geospatial AI workflows and agentic systems.
Learn more →Pricing that fits public budgets
starts as low as $199/month
Designed so that smaller towns with limited budgets can still make data-driven decisions. Every plan includes unlimited users and a dedicated Customer Success Manager.
$199/month
Towns and villages with limited budgets
$415/month
Growing cities and park districts
$830/month
Big-city parks and recreation systems
$1,245/month
Countywide agencies and regional park districts
$1,660/month
Major metropolitan parks and recreation agencies
Every tier includes the full CityParks feature set — the only difference is the size of the community you serve.
Contact Us for a Demo & Pricing