
CityTransit
CityTransit provides ridership intelligence for rail, bus and light-rail agencies. Built on consented, anonymized mobile location data and calibrated to each agency’s own counts and surveys, it shows boardings, rider origins and destinations, first- and last-mile access, demographics and spending for any line, station or custom area on an interactive map, in ready-made reports, and through our chatbot.
- Economically priced
- Unlimited users
- Available through NASPO
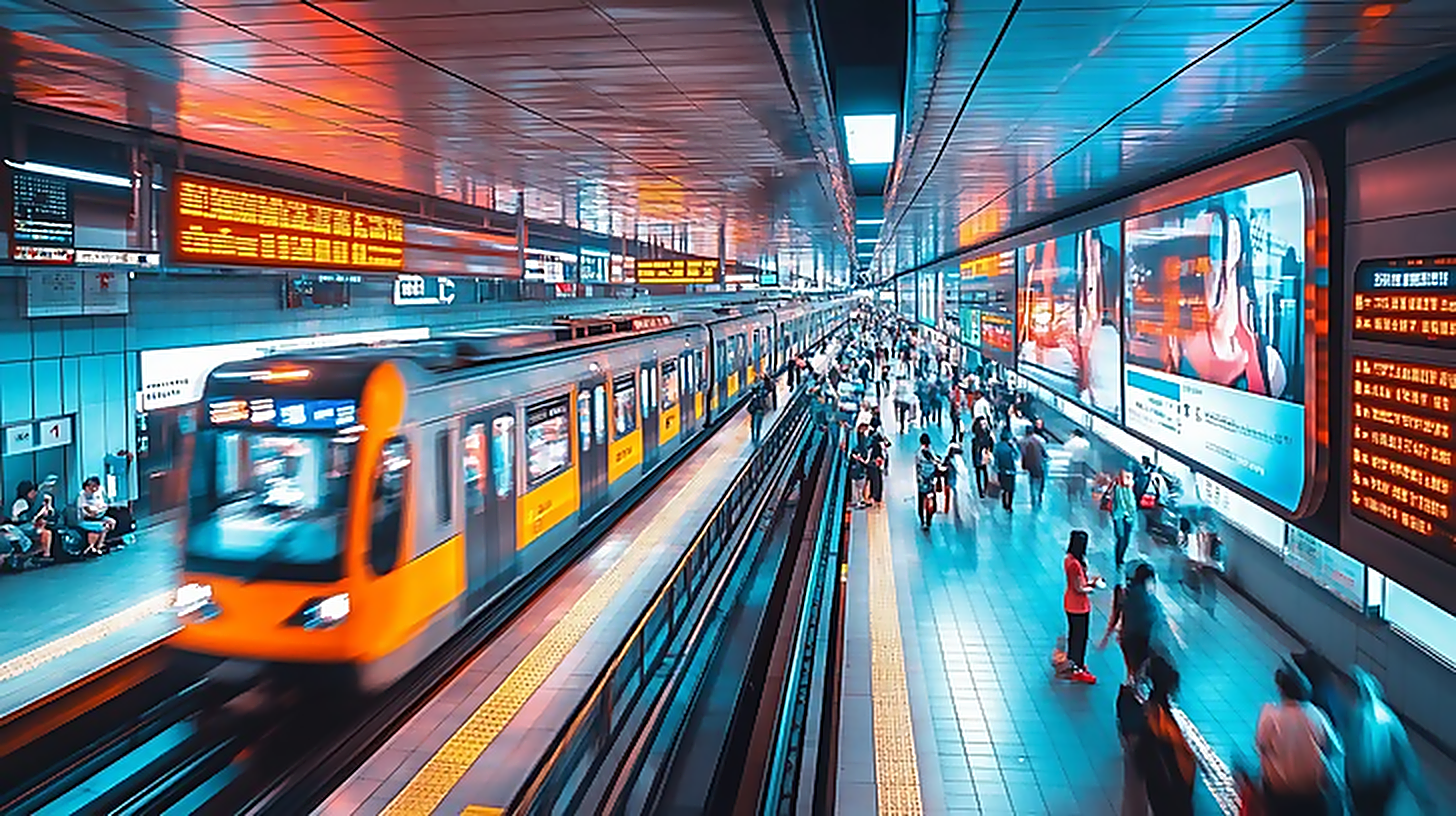
How transit teams put CityTransit to work
From planning to marketing, rail, bus and light-rail agencies turn station-level ridership and movement intelligence into data-driven decisions.
Service & Network Planning
Plan routes, frequencies, and stops with real boardings, alightings, and origin-destination demand by line and station.
Ridership Growth & Recovery
Find high-propensity, low-riding neighborhoods and win back “missing riders” with targeted outreach and service.
Station & Service Operations
See boardings and alightings by hour and day-type to right-size service, manage crowding, and plan transfers.
Grant Applications & Title VI
Back FTA and state funding and equity analyses with calibrated ridership, access, and demographic evidence.
Service Changes & Special Events
Size service for events and measure the before-and-after impact of schedule, route, or fare changes.
Marketing & TOD Targeting
Target riders and transit-oriented development with first/last-mile access, demographics, and spending around stations.
The many ways CityTransit grows your ridership
An impressive collection of features and capabilities that rail, bus and light-rail agencies use every day to understand and grow ridership.
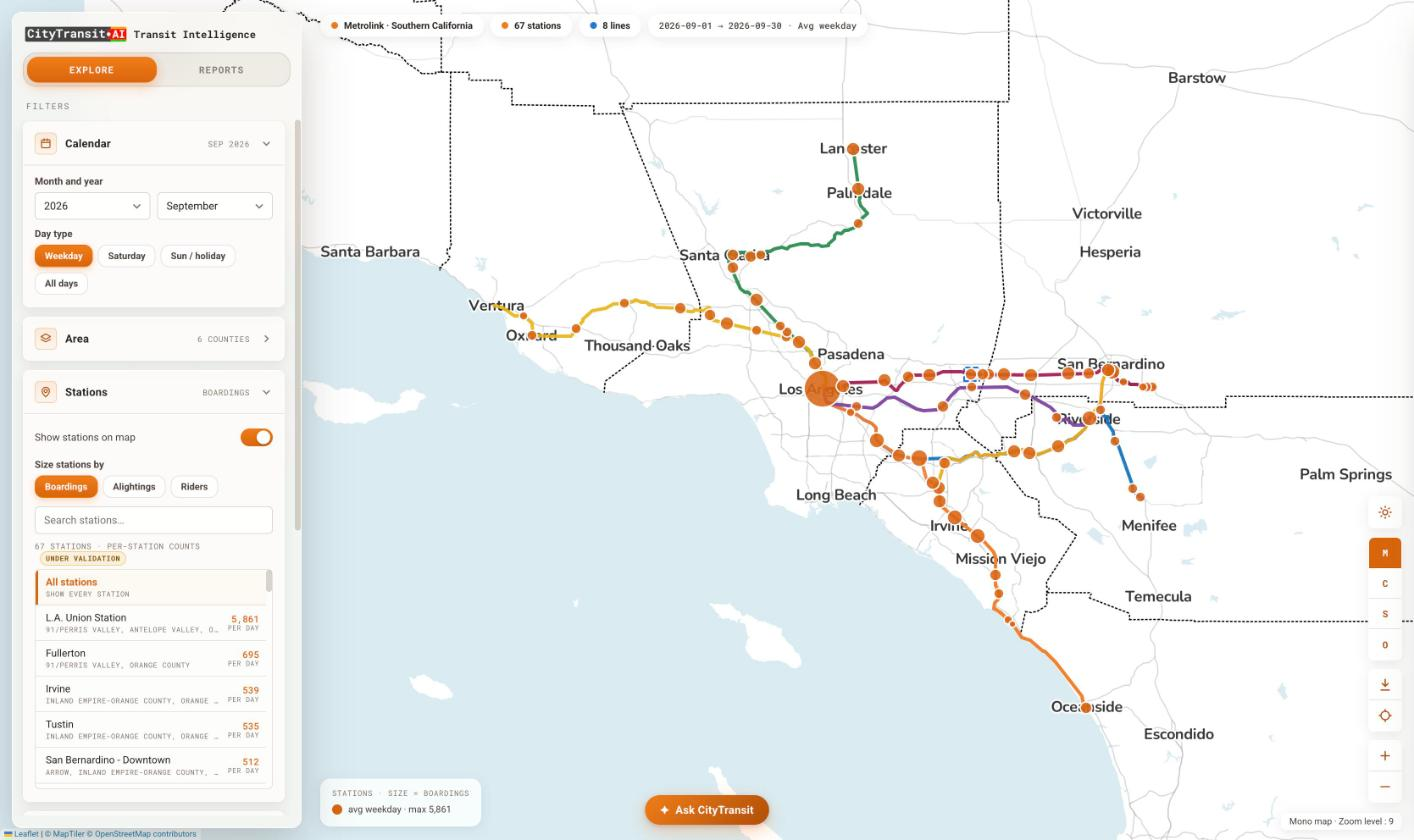
Network Ridership Map
Every station on your rail, bus and light-rail network, sized live by boardings, alightings or riders, with calendar, county and line filters to focus any view.
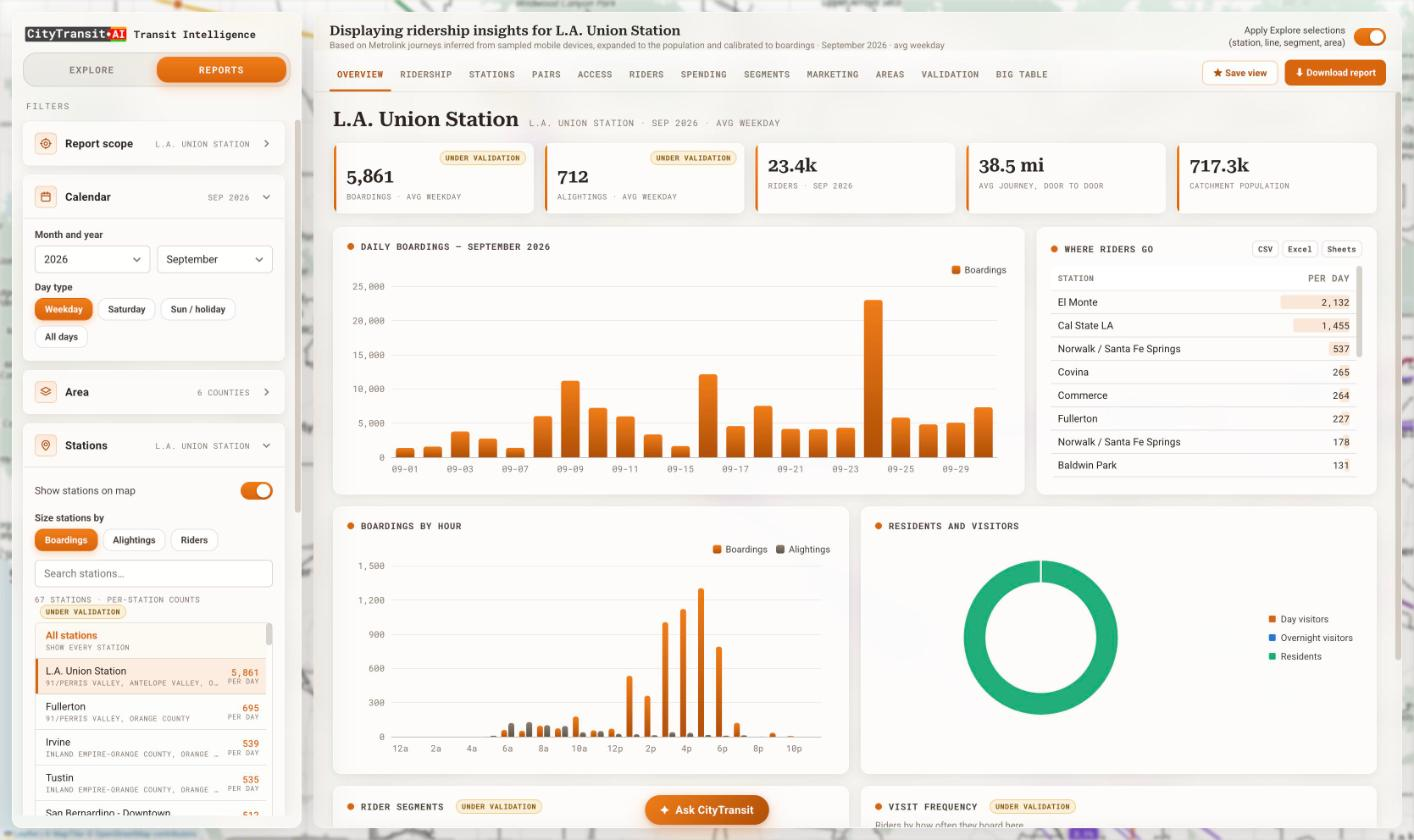
Boardings, Alightings & Trends
Daily and hourly boardings and alightings for any station, line or custom area, plus residents-versus-visitors and where riders go — all calibrated to your own counts.
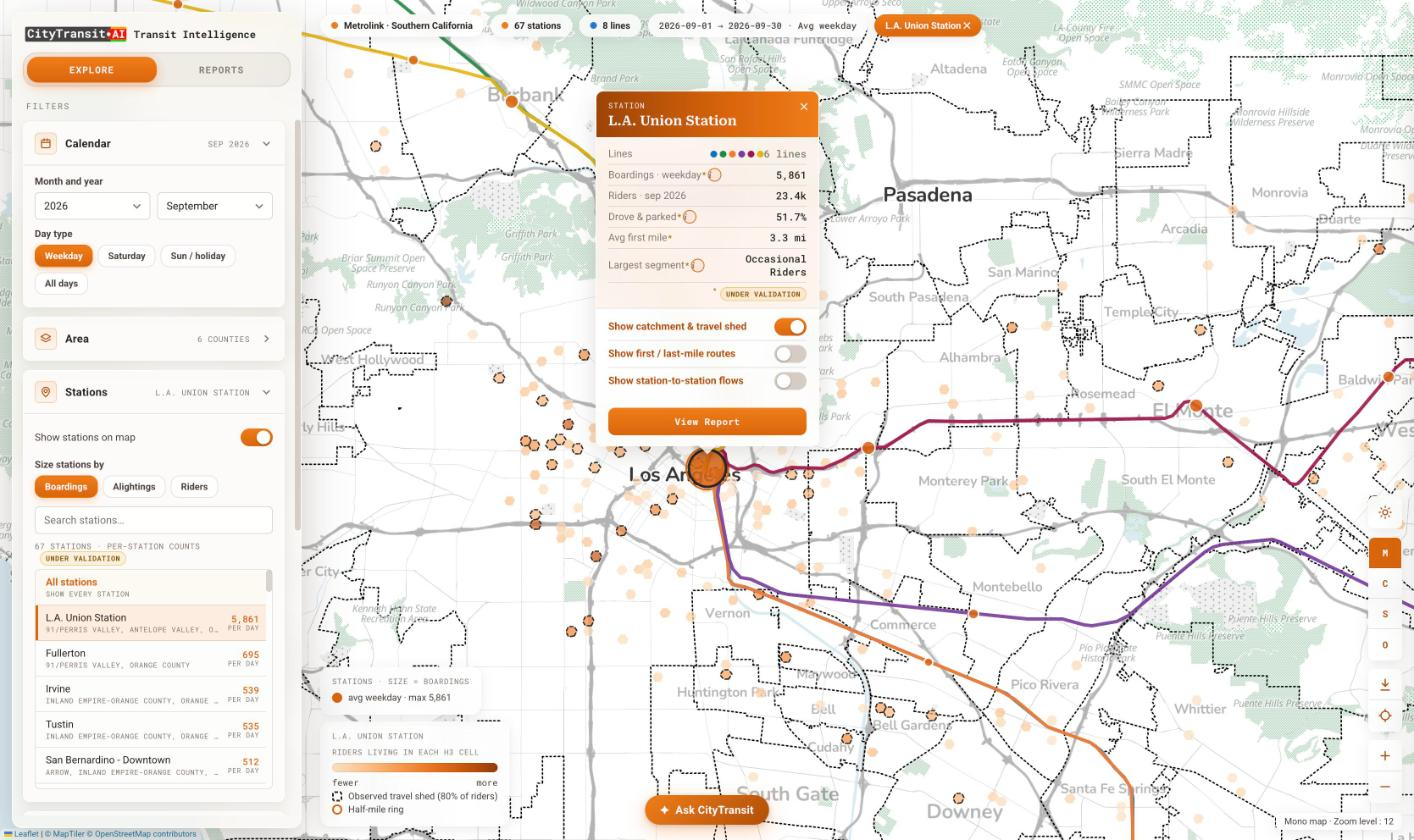
Rider Origins & Travel Shed
See where each station’s riders actually live as high-resolution H3 cells, and the observed travel shed that captures 80% of riders — far beyond the conventional half-mile ring.
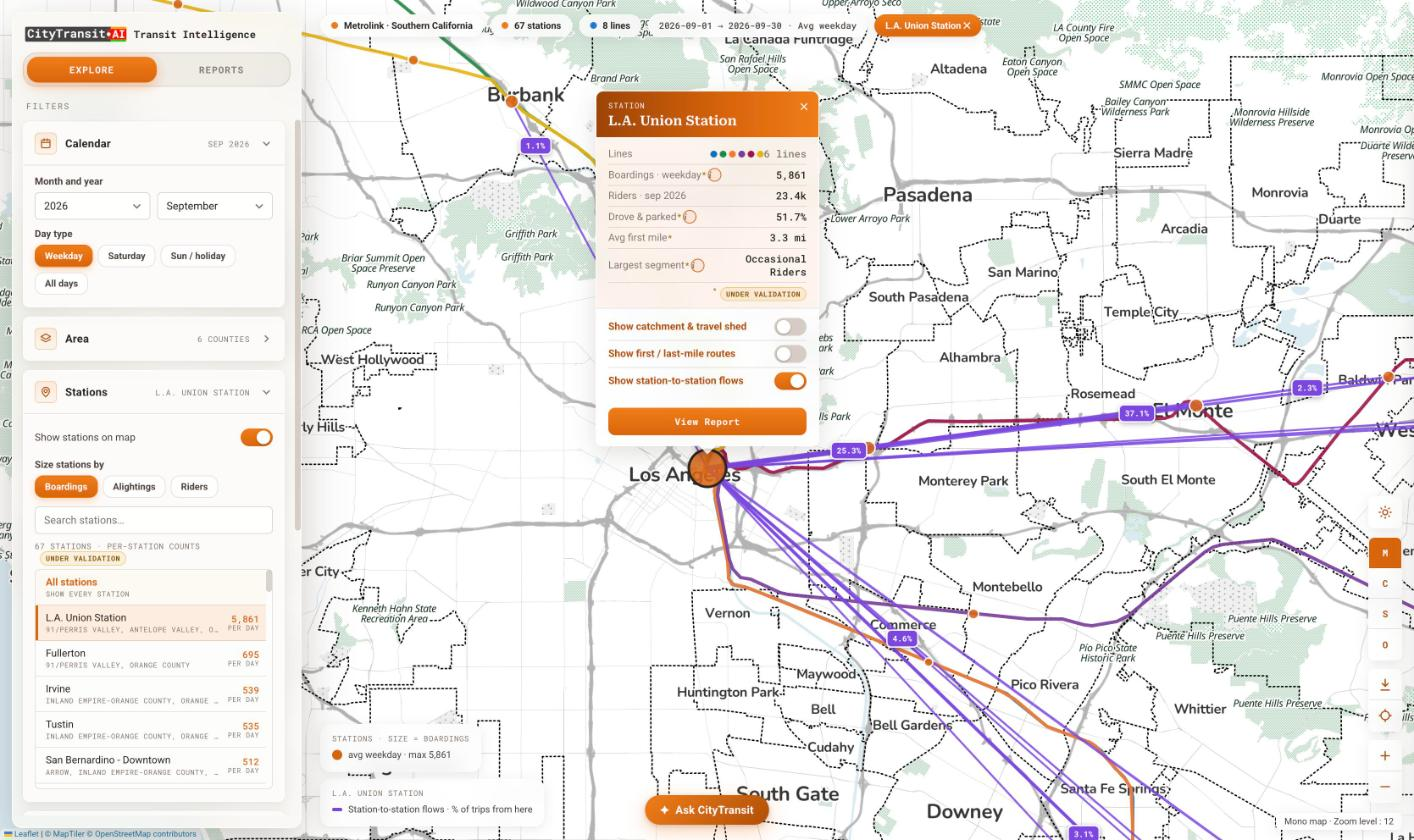
Origin–Destination Flows
Station-to-station trip flows that reveal the share of trips between every station pair, so you can see the corridors your riders actually travel.
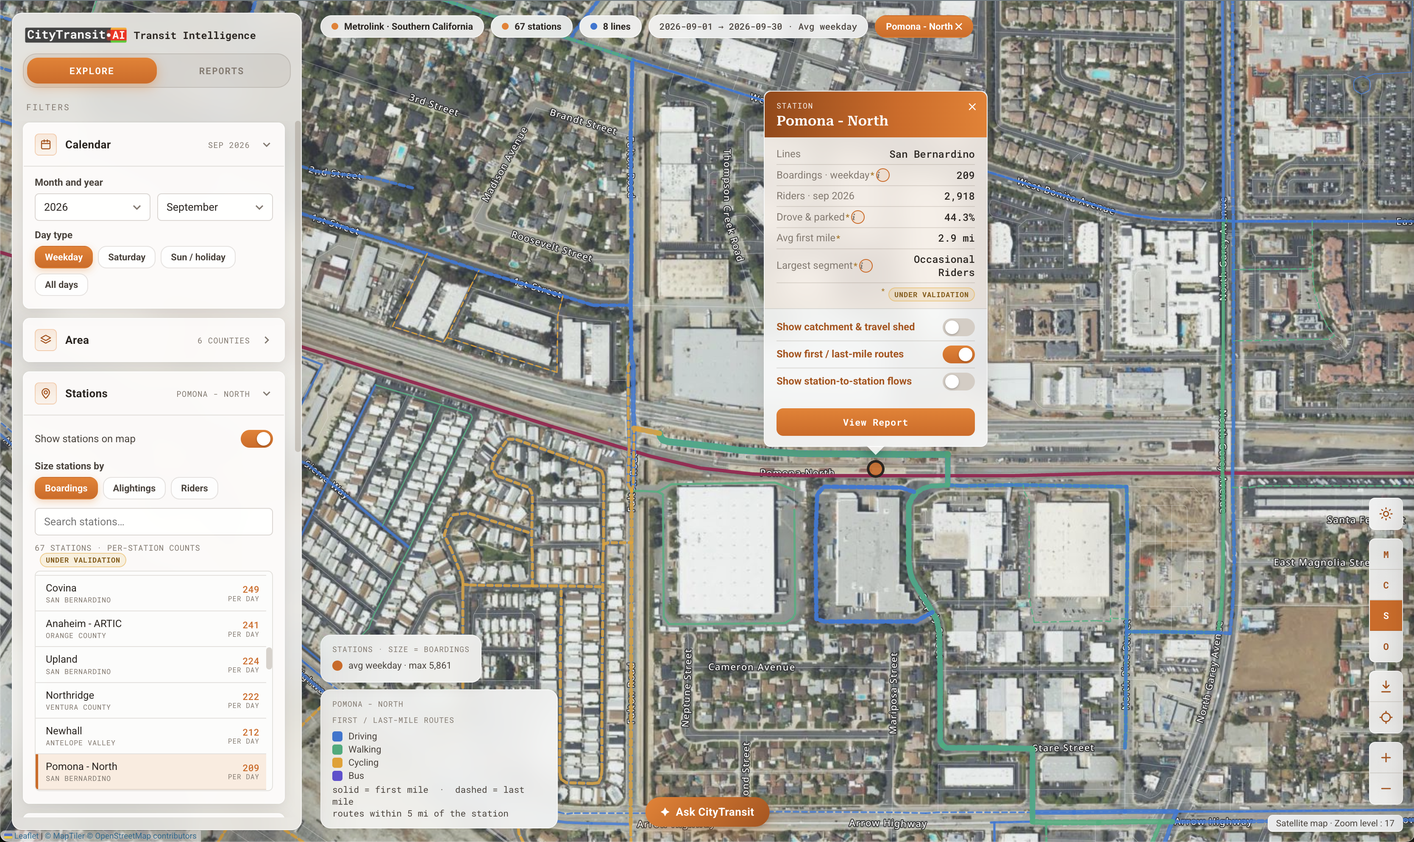
Multimodal Trips to Stations
The real driving, walking, cycling, and bus trips riders take to and from each station — first-mile routes (solid) and last-mile routes (dashed) mapped within five miles of the platform — so you can see exactly how people connect to transit and where to invest in parking, bike lanes, sidewalks, and feeder service.
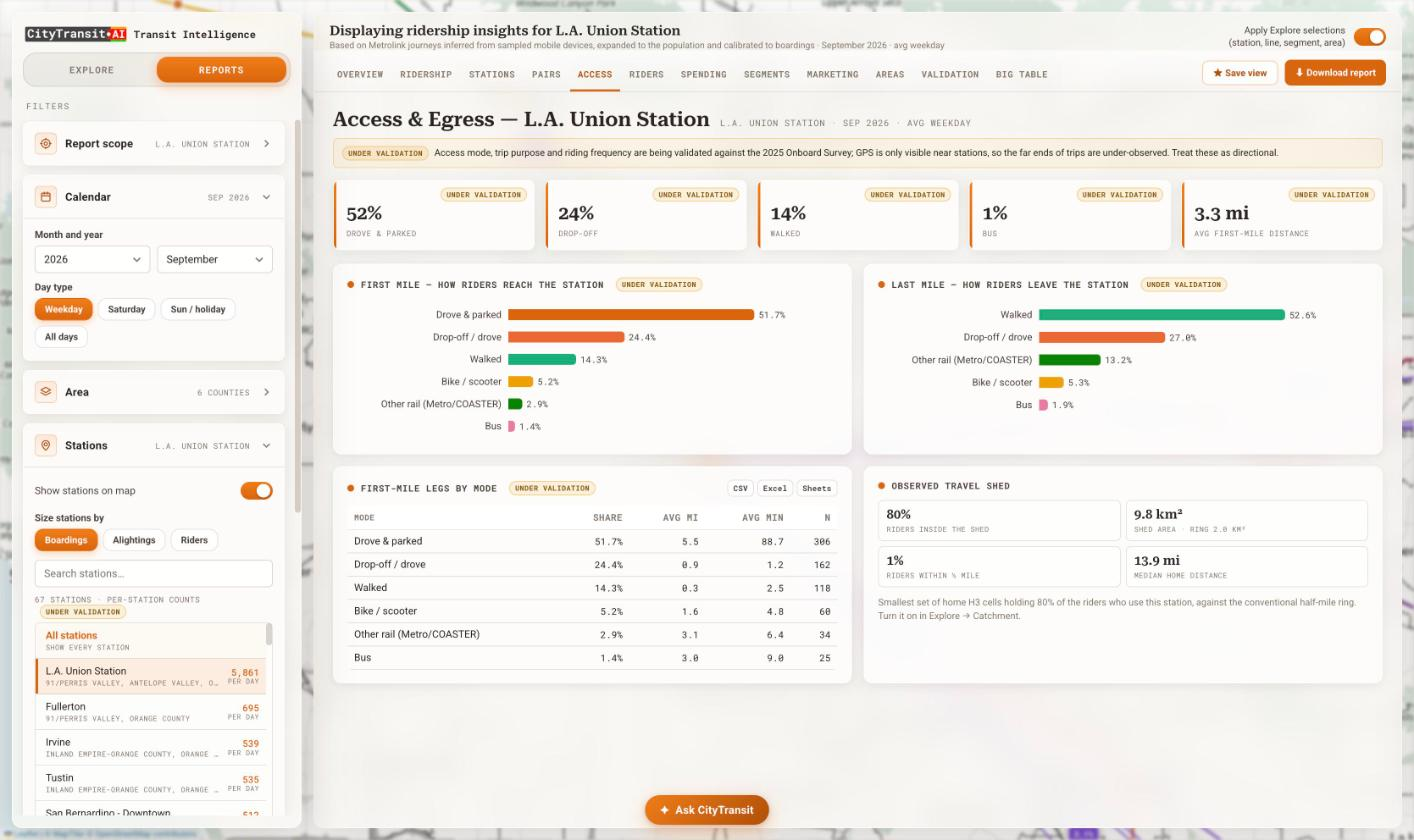
First- & Last-Mile Access
How riders reach and leave every station — drove & parked, drop-off, walk, bike or scooter, bus and connecting rail — with access distances and times by mode.
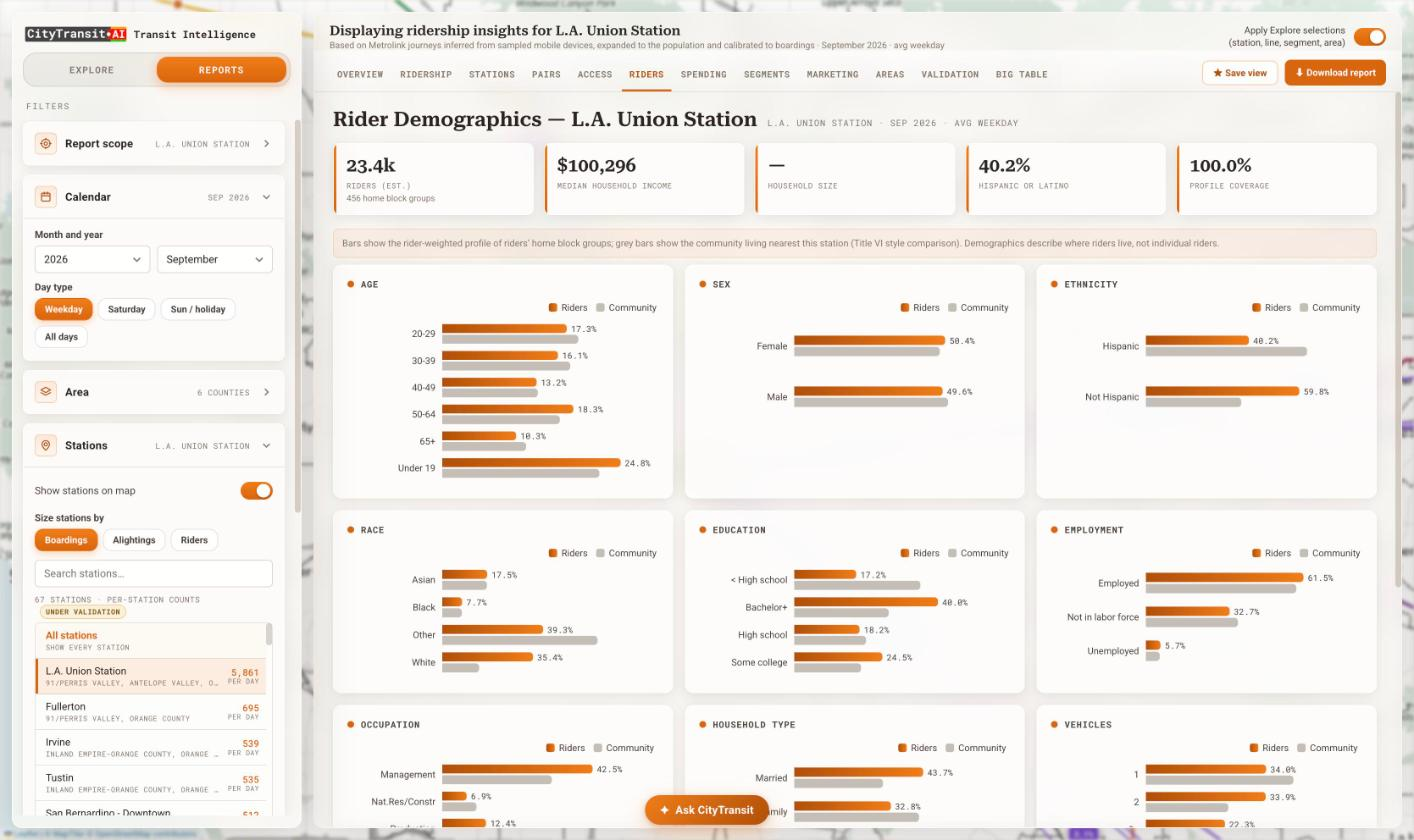
Rider Demographics (Title VI)
Rider-weighted age, race, income, education, employment and vehicle access, compared against the surrounding community for ready-made Title VI equity analysis.
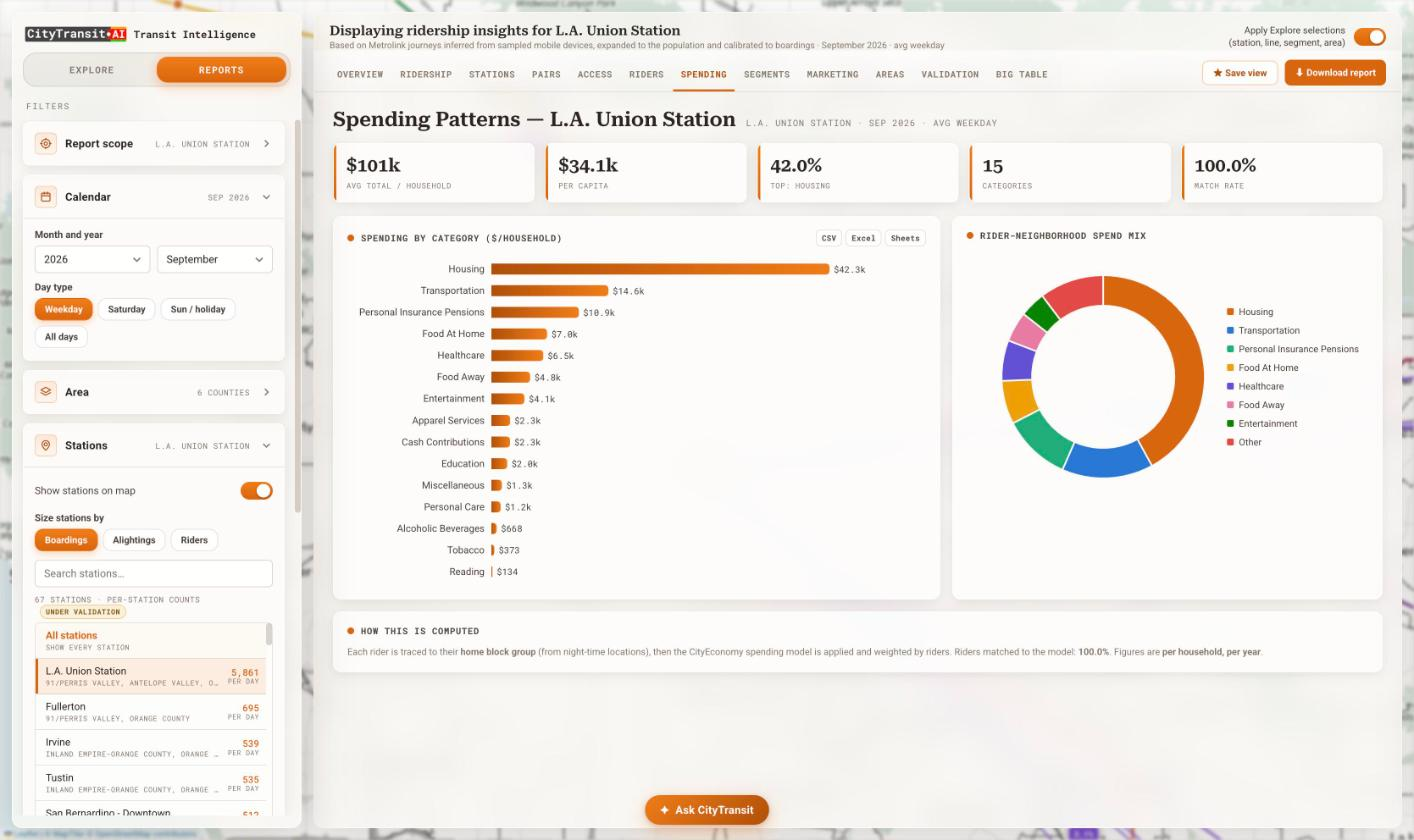
Rider Spending Patterns
Per-household spending across 15+ categories for each station’s riders, powered by the CityEconomy model — ideal for TOD, retail and sponsorship conversations.
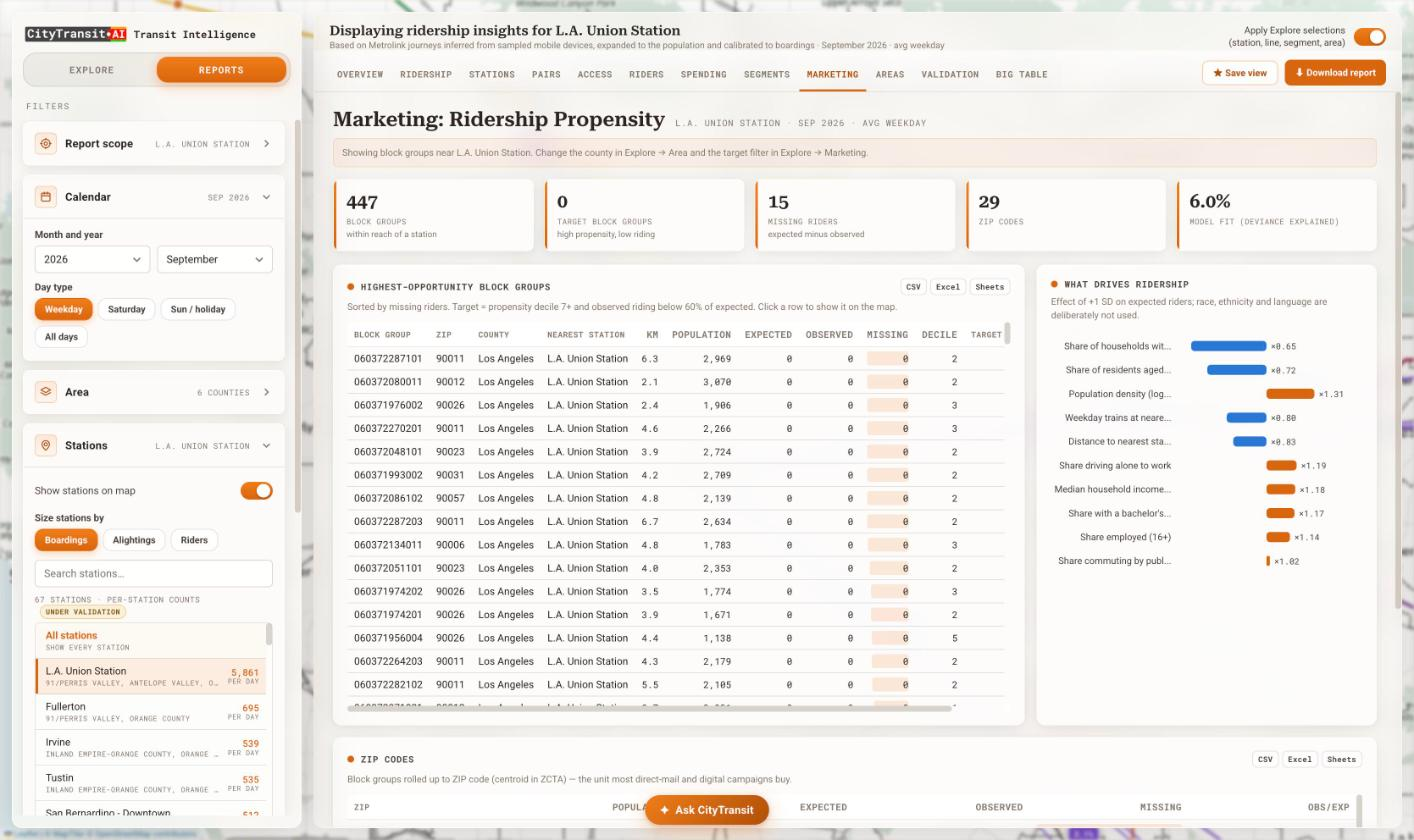
Ridership Propensity & Targeting
Pinpoint the highest-opportunity block groups and ZIP codes with high propensity but low riding — the “missing riders” to win back with targeted marketing.
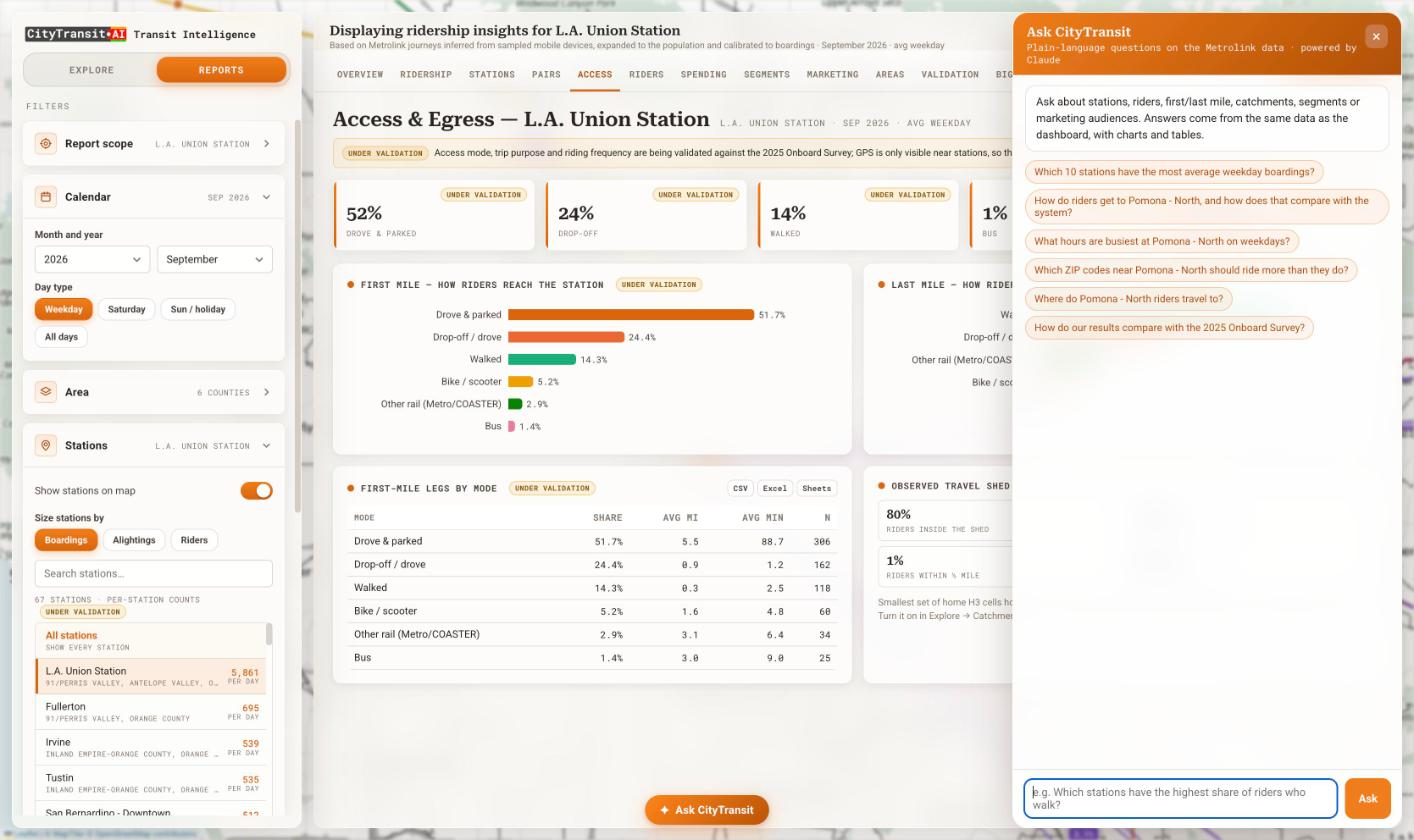
Ask CityTransit
Ask plain-language questions about stations, riders, access, catchments and segments and get answers — with charts and tables — drawn from the very same data.
Everything included
The full CityTransit feature list, standard with every subscription.
- Privacy-compliant, consented, anonymized, and aggregated mobile location data
- Calibrated to your own faregate, APC, and onboard-survey counts
- Full dashboard that works on desktop and mobile
- Unlimited users within your organization at no extra cost
- Dashboard link and branding customized with your agency name and logo
- Covers rail, bus, and light-rail — any line, station, or custom area
- Weekday, Saturday, and Sunday/holiday day-types, by month
- Ready-made, downloadable station and system reports
- Unlimited data exports to Excel, CSV, and Google Sheets
- API and direct Google BigQuery access for programmatic queries
- Internal version for your team and an external version for the public and stakeholders
- Dedicated Customer Success Manager and Account Manager
Works better together
CityTransit is part of the Bus, Metro, and Rail Transit solution. Pair it with these products:
CityFlow
See exactly how the people move through your city by cars, bikes, buses, trains, or on foot, to pinpoint exactly where congestion starts.
Learn more →CityAir
Grow urban air mobility service with vertiport analysis, air-taxi demand estimation, fleet sizing, and revenue projections for eVTOL manufacturers and operators.
Learn more →CityEconomy
Boost downtowns areas, business zones, and commercial districts with policies based on real-world footfalls and economic activity measurement.
Learn more →CitySim
Simulate the flow in multimodal networks to create digital twins for intervention analyses, impact forecast, and investment decisions.
Learn more →Pricing that scales with your network
Like CityFlow and CityAir, CityTransit uses a fixed-fee subscription model for predictable budgeting. Your fee is based on the geographic extent you analyze — a single agency, a multi-system region, or a whole state — plus any optional professional services such as custom corridor studies, onboard-survey calibration, or bespoke analytics.
Every plan includes unlimited users, the full CityTransit feature set, and a dedicated Customer Success Manager.
Contact Us for a Demo & Pricing